Variable Radius Pie Chart
A demo of amCharts 4, the previous version. See it in amCharts 5.
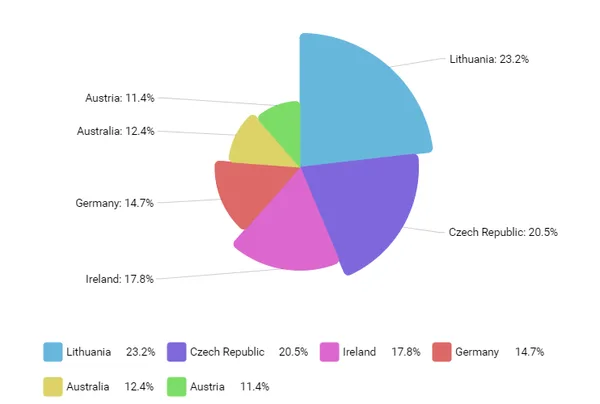
Individual radii for each slice
Each slice in pie series can have individual radius value, coming directly from data.
Slices with rounded corners
Rounded corners are not just for square objects. Now slices can also look nice and smooth.
This is the amCharts 4 version. See this demo in amCharts 5
Open in:
Code
JavaScript
// Themes begin
am4core.useTheme(am4themes_animated);
// Themes end

// Create chart
var chart = am4core.create("chartdiv", am4charts.PieChart);
chart.hiddenState.properties.opacity = 0; // this creates initial fade-in

chart.data = [
  {
    country: "Lithuania",
    value: 260
  },
  {
    country: "Czechia",
    value: 230
  },
  {
    country: "Ireland",
    value: 200
  },
  {
    country: "Germany",
    value: 165
  },
  {
    country: "Australia",
    value: 139
  },
  {
    country: "Austria",
    value: 128
  }
];

var series = chart.series.push(new am4charts.PieSeries());
series.dataFields.value = "value";
series.dataFields.radiusValue = "value";
series.dataFields.category = "country";
series.slices.template.cornerRadius = 6;
series.colors.step = 3;

series.hiddenState.properties.endAngle = -90;

chart.legend = new am4charts.Legend();
HTML
<div id="chartdiv"></div>CSS
#chartdiv {
  width: 100%;
  height: 500px;
}
Resources
https://cdn.amcharts.com/lib/4/core.js
https://cdn.amcharts.com/lib/4/charts.js
https://cdn.amcharts.com/lib/4/themes/animated.js
All in one page
<!-- Resources -->
<script src="https://cdn.amcharts.com/lib/4/core.js"></script>
<script src="https://cdn.amcharts.com/lib/4/charts.js"></script>
<script src="https://cdn.amcharts.com/lib/4/themes/animated.js"></script>

<!-- Chart code -->
<script>
// Themes begin
am4core.useTheme(am4themes_animated);
// Themes end

// Create chart
var chart = am4core.create("chartdiv", am4charts.PieChart);
chart.hiddenState.properties.opacity = 0; // this creates initial fade-in

chart.data = [
  {
    country: "Lithuania",
    value: 260
  },
  {
    country: "Czechia",
    value: 230
  },
  {
    country: "Ireland",
    value: 200
  },
  {
    country: "Germany",
    value: 165
  },
  {
    country: "Australia",
    value: 139
  },
  {
    country: "Austria",
    value: 128
  }
];

var series = chart.series.push(new am4charts.PieSeries());
series.dataFields.value = "value";
series.dataFields.radiusValue = "value";
series.dataFields.category = "country";
series.slices.template.cornerRadius = 6;
series.colors.step = 3;

series.hiddenState.properties.endAngle = -90;

chart.legend = new am4charts.Legend();
</script>

<!-- HTML -->
<div id="chartdiv"></div>