XY Chart with Fills to the Axis
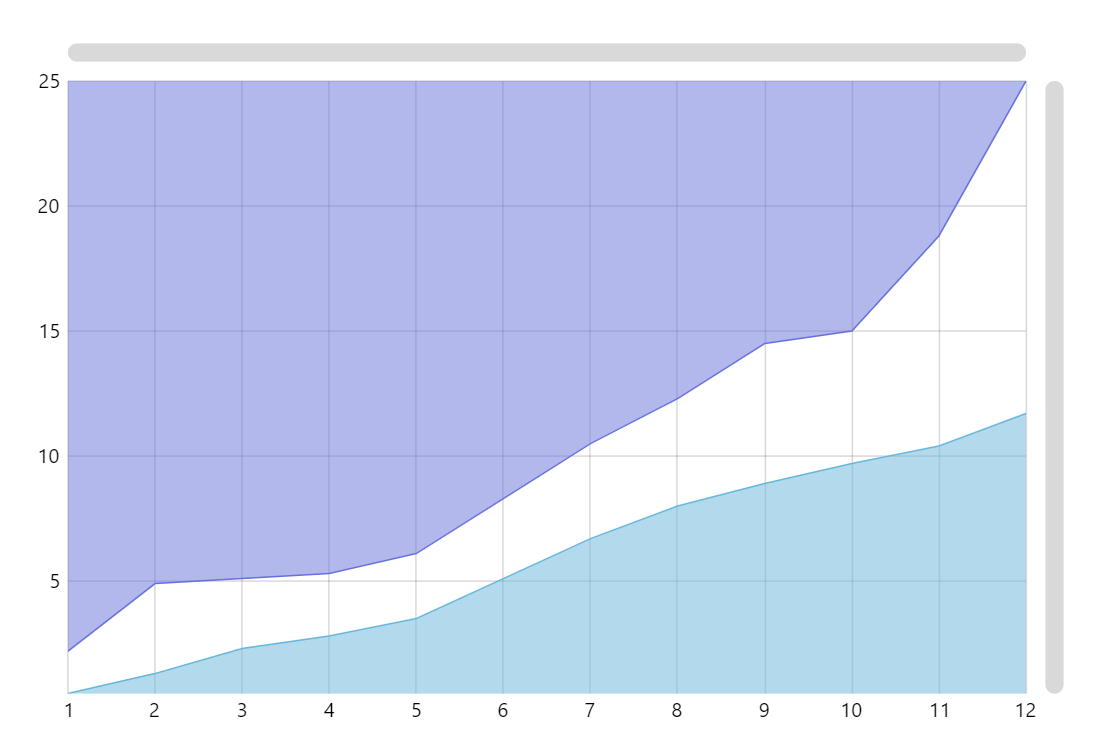
This demo shows how to create area chart series with fills going to different axes. As you can see, the fill of the lower series goes to the X axis, while the upper series is filled to the Y axis.
Key implementation details
To achieve this all we need to do is set baseAxis on the series. The series is then filled towards that axis.
Related tutorials
Build this chart with AI
The prompt below can be used to build this chart with AI. For best coding results, use the most advanced AI models, like Claude Opus 4.6 and GPT-5.3-Codex. For more info and tips, check out amCharts AI docs.
Create an XY scatter plot with two connected line series, each featuring semi-transparent area fills. One series fills downward toward the X-axis and the other fills toward the Y-axis, so their shaded regions face different directions. Use 12 data points with shared x-values. Apply distinct colors to each series. Include a crosshair cursor with tooltips showing x and y values. Add horizontal and vertical scrollbars. Animate on load. Use amCharts 5 library.
Demo source