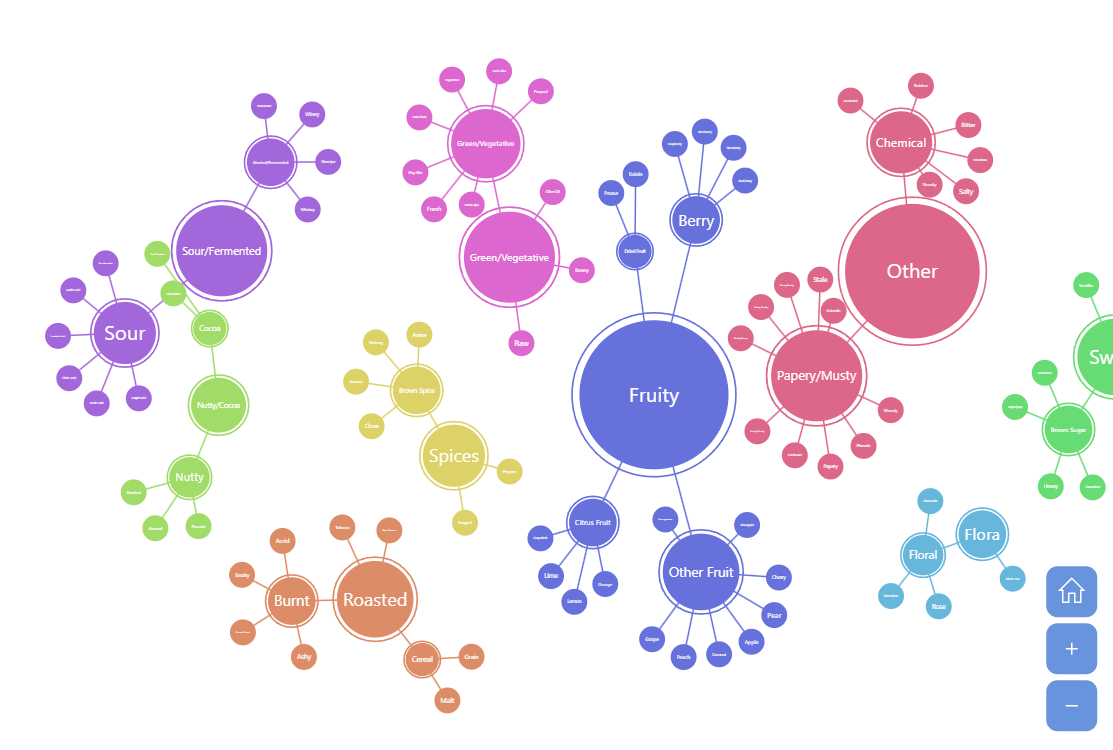
This chart is added to a Zoomable Container, so you can pan, zoom-in and zoom-out this chart using mouse wheel, pinch-zoom or zoom tools on the bottom-right.
Build this chart with AI
The prompt below can be used to build this chart with AI. For best coding results, use the most advanced AI models, like Claude Opus 5 and GPT-5.6-Codex. For more info and tips, check out amCharts AI docs.
Create a zoomable force-directed tree chart displaying a coffee flavor wheel hierarchy. The root connects to major flavor categories (Flora, Fruity, Sour/Fermented, Green/Vegetative, Other, Roasted, Spices, Nutty/Cocoa, Sweet) with subcategories and leaf nodes containing values. Render nodes as colored circles with stepped color differentiation. Links connect parent and child nodes with moderate strength. Wrap the chart in a zoomable container with mouse wheel zoom, pinch-zoom, and drag-to-pan. Add zoom controls in the bottom-right corner. The root node should be pre-selected. Animate the series with a smooth staggered animation. Use amCharts 5 library.
Demo source