In this walkthrough we will create a simple Vue.js app (using Vue CLI), add a simple amCharts 4 bar chart to it, and then add amCharts Editor 4, and wire it up to edit this simple chart.
Follow along or just lookup the sections you are interested in below.
Vue CLI
Let’s create a simple Vue.js app as the basis for our project. We will use Vue CLI for this. Make sure you have Vue CLI installed or follow the steps here to install it.
Now let’s run it to create a simple new Vue app:
vue create my-vue-editor-app
I will select features manually so you have a better insight in what was selected in case presets change between when I’m writing this and when you follow it. So, let’s chose “Manually select features” in the first step. Obviously, you can select whatever features you need or want but if you want to follow along here’s what I’m selecting:
- In the next step I will only select “Babel” and “TypeScript”.
- Then I’m selecting Vue version 3.x.
- Next, “Use class-style component syntax?” – yes.
- “Use Babel alongside TypeScript…” – yes.
- “Where do you prefer placing config for Babel, ESLint, etc.?” – “In dedicated config files”.
- We don’t need to save it as a preset.
So, that’s it. Now wait for Vue CLI to do it thing.
Once done, open the directory in your code editor of choice and let’s finish setting app our app shell. We will change as little as needed for this demo.
Let’s start in src/App.vue. We will remove the Vue.js logo and just change the message for the HelloWorld component. So the whole file looks like this:
<template>
  <HelloWorld msg="amCharts Editor 4 Demo."/>
</template>

<script lang="ts">
import { Options, Vue } from 'vue-class-component';
import HelloWorld from './components/HelloWorld.vue';

@Options({
  components: {
    HelloWorld,
  },
})
export default class App extends Vue {}
</script>

<style>
#app {
  font-family: Avenir, Helvetica, Arial, sans-serif;
  -webkit-font-smoothing: antialiased;
  -moz-osx-font-smoothing: grayscale;
  text-align: center;
  color: #2c3e50;
  margin-top: 60px;
}
</style>
And in src/components/HelloWorld.vue remove everything from the template except for the message.
<template>
  <div class="hello">
    <h1>{{ msg }}</h1>
  </div>
</template>

<script lang="ts">
import { Options, Vue } from 'vue-class-component';

@Options({
  props: {
    msg: String
  }
})
export default class HelloWorld extends Vue {
  msg!: string
}
</script>

<!-- Add "scoped" attribute to limit CSS to this component only -->
<style scoped>
h3 {
  margin: 40px 0 0;
}
ul {
  list-style-type: none;
  padding: 0;
}
li {
  display: inline-block;
  margin: 0 10px;
}
a {
  color: #42b983;
}
</style>
Adding amCharts 4
It’s time to add amCharts to our project. From the terminal run:
npm install @amcharts/amcharts4
or
yarn add @amcharts/amcharts4
Add imports for amCharts classes in HelloWorld.vue:
import * as am4core from '@amcharts/amcharts4/core';
import * as am4charts from '@amcharts/amcharts4/charts';
import '@amcharts/amcharts4/charts';
Note: That last line is only needed here because in our simple example we are not explicitly using anything from am4charts and it gets “optimized” out of the final bundle. In a more advanced application you would likely use classes from am4charts and this “workaround” won’t be necessary.
Now let’s setup our component to show the chart.
We need to do 4 things:
- Define fields to store our chart and chart configuration.
- Set initial chart configuration;
- Add a div to host our chart.
- Create our chart in
mounted()and dispose of it inunmounted().
IMPORTANTFor performance considerations amCharts performs some operations directly on the passed configuration object. For this reason, in cases when you need the configuration to remain intact after rendering a chart, you should never pass a chart configuration object directly to am4core.createFromConfig() and pass a copy instead.
At this stage your HelloWorld.vue should look something like this:
<template>
  <div class="hello">
    <h1>{{ msg }}</h1>
    <div id="chartdiv" class="chartdiv"></div>
  </div>
</template>

<script lang="ts">
import { Options, Vue } from 'vue-class-component';

import * as am4core from '@amcharts/amcharts4/core';
import * as am4charts from '@amcharts/amcharts4/charts';
import '@amcharts/amcharts4/charts';

let chart: am4core.Sprite;
let chartConfiguration: object = {
  "type": "XYChart",
  "data": [{
      "category": "Category #1",
      "value": 4032
  }, {
      "category": "Category #2",
      "value": 724
  }, {
      "category": "Category #3",
      "value": 4015
  }, {
      "category": "Category #4",
      "value": 4232
  }],
  "xAxes": [{
      "type": "ValueAxis",
      "renderer": {
          "maxLabelPosition": 0.98
      }
  }],
  "yAxes": [{
      "type": "CategoryAxis",
      "dataFields": {
          "category": "category"
      },
      "renderer": {
          "grid": {
              "template": {
                  "type": "Grid",
                  "location": 0
              }
          },
      }
  }],
  "series": [{
      "type": "ColumnSeries",
      "columns": {
          "template": {
              "type": "Column",
              "strokeOpacity": 0,
              "tooltipText": "{categoryY}\n{valueX}",
              "tooltipPosition": "pointer"
          }
      },
      "dataFields": {
          "valueX": "value",
          "categoryY": "category"
      },
  }]
};

@Options({
  props: {
    msg: String
  }
})
export default class HelloWorld extends Vue {
  msg!: string

  mounted() {
    this.renderChart();
  }

  renderChart() {
    if (chart) {
      chart.dispose();
    }
    chart = am4core.createFromConfig(
      // IMPORTANT: for performance considerations amCharts performs some
      // operations directly on the passed configuration object. For this
      // reason, in cases when you need the configuration to remain intact
      // after rendering a chart, you should never pass a chart configuration
      // object directly to am4core.createFromConfig and pass a copy instead.
      JSON.parse(JSON.stringify(chartConfiguration)),
      'chartdiv'
    );
  }

  unmounted() {
    if (chart) {
      chart.dispose();
    }
  }
}
</script>

<!-- Add "scoped" attribute to limit CSS to this component only -->
<style scoped>
.chartdiv {
  width: 800px;
  height: 460px;
  margin: 20px auto;
}
h3 {
  margin: 40px 0 0;
}
ul {
  list-style-type: none;
  padding: 0;
}
li {
  display: inline-block;
  margin: 0 10px;
}
a {
  color: #42b983;
}
</style>
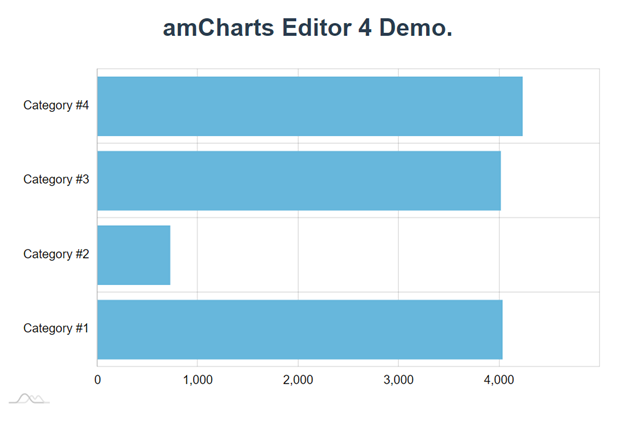
And your app should look something like this when launched:
Adding amCharts Editor 4
Now it’s time to add and setup amCharts Editor 4.
First we add it to our project. Run:
npm install @amcharts/editor4
or
yarn add @amcharts/editor4
The Editor is library-app combination (more on this here) so we need an extra step to include the app part in our project.
We need to tell our build process to copy the Editor app files into our output directory. To do that, in the root of your project create a vue.config.js file and add this config modification that tells it to do just that:
module.exports = {
  chainWebpack: config => {
    config
      .plugin('copy')
      .tap(args => {
        args[0].push({
          from: 'node_modules/@amcharts/editor4/am4editor',
          to: 'am4editor',
          toType: 'dir'
        });
        return args;
      })
  }
}
Launching amCharts 4 Editor
To edit the chart on our page we will:
- Import the Editor library.
- Add a button to let user initiate the editing and wire its click event to a method of our component.
- In this method we will instantiate an instance of the
EditorLauncher. - Launch it with our current chart configuration.
Add this import statement to the top of the script in HelloWorld.vue
import * as am4editor from '@amcharts/editor4';
Then just add a button to your render output:
<button @click="editChart">edit chart</button>
We need to add a field to store a reference to the Editor and, obviously, we need to define that editChart() method:
import * as am4editor from '@amcharts/editor4';
…
editChart() {
  launcher = new am4editor.EditorLauncher();
  launcher.launch(chartConfiguration);
}
Here we create an instance of EditorLauncher and launch passing our chart configuration.
At this point your complete HelloWorld.vue should look something like this:
<template>
  <div class="hello">
    <h1>{{ msg }}</h1>
    <div id="chartdiv" class="chartdiv"></div>
    <button @click="editChart">edit chart</button>
  </div>
</template>

<script lang="ts">
import { Options, Vue } from 'vue-class-component';

import * as am4core from '@amcharts/amcharts4/core';
import * as am4charts from '@amcharts/amcharts4/charts';
import '@amcharts/amcharts4/charts';

import * as am4editor from '@amcharts/editor4';

let chart: am4core.Sprite;
let chartConfiguration: object = {
  "type": "XYChart",
  "data": [{
      "category": "Category #1",
      "value": 4032
  }, {
      "category": "Category #2",
      "value": 724
  }, {
      "category": "Category #3",
      "value": 4015
  }, {
      "category": "Category #4",
      "value": 4232
  }],
  "xAxes": [{
      "type": "ValueAxis",
      "renderer": {
          "maxLabelPosition": 0.98
      }
  }],
  "yAxes": [{
      "type": "CategoryAxis",
      "dataFields": {
          "category": "category"
      },
      "renderer": {
          "grid": {
              "template": {
                  "type": "Grid",
                  "location": 0
              }
          },
      }
  }],
  "series": [{
      "type": "ColumnSeries",
      "columns": {
          "template": {
              "type": "Column",
              "strokeOpacity": 0,
              "tooltipText": "{categoryY}\n{valueX}",
              "tooltipPosition": "pointer"
          }
      },
      "dataFields": {
          "valueX": "value",
          "categoryY": "category"
      },
  }]
};

let launcher: am4editor.EditorLauncher;

@Options({
  props: {
    msg: String
  }
})
export default class HelloWorld extends Vue {
  msg!: string

  mounted() {
    this.renderChart();
  }

  renderChart() {
    if (chart) {
      chart.dispose();
    }
    chart = am4core.createFromConfig(
      // IMPORTANT: for performance considerations amCharts performs some
      // operations directly on the passed configuration object. For this
      // reason, in cases when you need the configuration to remain intact
      // after rendering a chart, you should never pass a chart configuration
      // object directly to am4core.createFromConfig and pass a copy instead.
      JSON.parse(JSON.stringify(chartConfiguration)),
      'chartdiv'
    );
  }

  unmounted() {
    if (chart) {
      chart.dispose();
    }
  }

  editChart() {
    launcher = new am4editor.EditorLauncher();
    launcher.launch(chartConfiguration);
  }
}
</script>

<!-- Add "scoped" attribute to limit CSS to this component only -->
<style scoped>
.chartdiv {
  width: 800px;
  height: 460px;
  margin: 20px auto;
}
h3 {
  margin: 40px 0 0;
}
ul {
  list-style-type: none;
  padding: 0;
}
li {
  display: inline-block;
  margin: 0 10px;
}
a {
  color: #42b983;
}
</style>
And now the editor should open when you click on the “edit chart” button. There is just one step missing – we need to handle the edited chart returned from the editor.
Getting the edited chart
First let’s handle the event for when a user just closes the Editor without saving. We can do it inline by adding a handler right in the editChart() method:
    launcher.addEventListener('close', () => {
      if (launcher) {
        launcher.close();
      }
    });
Next let’s hand the save event:
    launcher.addEventListener('save', (ev) => {
      if (ev) {
        chartConfiguration = ev.chartConfig;
        this.renderChart();
        if (launcher) {
          launcher.close();
        }
      }
    });
Here we assign the chart configuration we get from the Editor to our configuration field and re-render chart. And don’t forget to close the editor after that.
Now our basic chart editing example is complete and here’s the complete code for HelloWorld.vue:
<template>
  <div class="hello">
    <h1>{{ msg }}</h1>
    <div id="chartdiv" class="chartdiv"></div>
    <button @click="editChart">edit chart</button>
  </div>
</template>

<script lang="ts">
import { Options, Vue } from 'vue-class-component';

import * as am4core from '@amcharts/amcharts4/core';
import * as am4charts from '@amcharts/amcharts4/charts';
import '@amcharts/amcharts4/charts';

import * as am4editor from '@amcharts/editor4';

let chart: am4core.Sprite;
let chartConfiguration: object = {
  "type": "XYChart",
  "data": [{
      "category": "Category #1",
      "value": 4032
  }, {
      "category": "Category #2",
      "value": 724
  }, {
      "category": "Category #3",
      "value": 4015
  }, {
      "category": "Category #4",
      "value": 4232
  }],
  "xAxes": [{
      "type": "ValueAxis",
      "renderer": {
          "maxLabelPosition": 0.98
      }
  }],
  "yAxes": [{
      "type": "CategoryAxis",
      "dataFields": {
          "category": "category"
      },
      "renderer": {
          "grid": {
              "template": {
                  "type": "Grid",
                  "location": 0
              }
          },
      }
  }],
  "series": [{
      "type": "ColumnSeries",
      "columns": {
          "template": {
              "type": "Column",
              "strokeOpacity": 0,
              "tooltipText": "{categoryY}\n{valueX}",
              "tooltipPosition": "pointer"
          }
      },
      "dataFields": {
          "valueX": "value",
          "categoryY": "category"
      },
  }]
};

let launcher: am4editor.EditorLauncher;

@Options({
  props: {
    msg: String
  }
})
export default class HelloWorld extends Vue {
  msg!: string

  mounted() {
    this.renderChart();
  }

  renderChart() {
    if (chart) {
      chart.dispose();
    }
    chart = am4core.createFromConfig(
      // IMPORTANT: for performance considerations amCharts performs some
      // operations directly on the passed configuration object. For this
      // reason, in cases when you need the configuration to remain intact
      // after rendering a chart, you should never pass a chart configuration
      // object directly to am4core.createFromConfig and pass a copy instead.
      JSON.parse(JSON.stringify(chartConfiguration)),
      'chartdiv'
    );
  }

  unmounted() {
    if (chart) {
      chart.dispose();
    }
  }

  editChart() {
    launcher = new am4editor.EditorLauncher();
    launcher.addEventListener('close', () => {
      if (launcher) {
        launcher.close();
      }
    });
    launcher.addEventListener('save', (ev) => {
      if (ev) {
        chartConfiguration = ev.chartConfig;
        this.renderChart();
        if (launcher) {
          launcher.close();
        }
      }
    });
    launcher.launch(chartConfiguration);
  }
}
</script>

<!-- Add "scoped" attribute to limit CSS to this component only -->
<style scoped>
.chartdiv {
  width: 800px;
  height: 460px;
  margin: 20px auto;
}
h3 {
  margin: 40px 0 0;
}
ul {
  list-style-type: none;
  padding: 0;
}
li {
  display: inline-block;
  margin: 0 10px;
}
a {
  color: #42b983;
}
</style>
Useful links: