In this walkthrough we will create a very simple web page displaying an amCharts 4 bar chart and then add amCharts 4 Editor and wire it up to edit this simple chart.
We won’t use any package managers, bundlers, transpilers or other “fancy” technologies in this walkthrough. This is will be just a plain HTML/JavaScript example. For uses in other environments please refer to other walkthroughs.
Follow along or just lookup the sections you are interested in below.
Setup
Download amCharts 4 from here and amCharts Editor 4 from here.
Create a directory for this project and extract files from both archives into this directory.
After doing this your directory should look something like this:
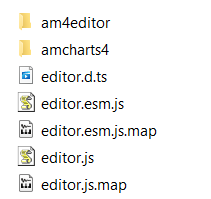
Note: you can move all of these top-level files into a sub-directory for your choice to make it tidier. But for the sake of simplicity we will leave it as is in this walkthrough.
Now, let’s add a simple index.html page. Something like this:
<!DOCTYPE html>
<html lang="en">
<head>
  <meta charset="UTF-8">
  <meta name="viewport" content="width=device-width, initial-scale=1.0">
  <title>amCharts Editor 4 Demo.</title>
  <style type="text/css">
    body {
      text-align: center;
    }
  </style>
</head>
<body>
  <h1>amCharts Editor 4 Demo.</h1>
</body>
</html>
Adding amCharts 4
Now let’s add a simple bar chart.
Add amCharts scripts to the <head> section of your page:
<script src="amcharts4/core.js"></script>
<script src="amcharts4/charts.js"></script>
Now let’s define variables to hold our chart reference and cart configuration:
  <script>
    let chart;
    let chartConfiguration = {
      "type": "XYChart",
      "data": [{
          "category": "Category #1",
          "value": 4032
      }, {
          "category": "Category #2",
          "value": 724
      }, {
          "category": "Category #3",
          "value": 4015
      }, {
          "category": "Category #4",
          "value": 4232
      }],
      "xAxes": [{
          "type": "ValueAxis",
          "renderer": {
              "maxLabelPosition": 0.98
          }
      }],
      "yAxes": [{
          "type": "CategoryAxis",
          "dataFields": {
              "category": "category"
          },
          "renderer": {
              "grid": {
                  "template": {
                      "type": "Grid",
                      "location": 0
                  }
              },
          }
      }],
      "series": [{
          "type": "ColumnSeries",
          "columns": {
              "template": {
                  "type": "Column",
                  "strokeOpacity": 0,
                  "tooltipText": "{categoryY}\n{valueX}",
                  "tooltipPosition": "pointer"
              }
          },
          "dataFields": {
              "valueX": "value",
              "categoryY": "category"
          },
      }]
    };
  </script>
We also need to add a div on the page to hold our chart:
<div id="chartdiv" style="width: 800px; height: 460px; margin: 20px auto;"></div>
Now, when the page loads let’s create the chart with this config:
IMPORTANT For performance considerations amCharts performs some operations directly on the passed configuration object. For this reason, in cases when you need the configuration to remain intact after rendering a chart, you should never pass a chart configuration object directly to am4core.createFromConfig and pass a copy instead.
    document.addEventListener("DOMContentLoaded", ready);

    function ready() {
      renderChart();
    }

    function renderChart() {
      if (chart) {
        chart.dispose();
      }
      chart = am4core.createFromConfig(
        // IMPORTANT: for performance considerations amCharts performs some
        // operations directly on the passed configuration object. For this
        // reason, in cases when you need the configuration to remain intact
        // after rendering a chart, you should never pass a chart configuration
        // object directly to am4core.createFromConfig and pass a copy instead.
        JSON.parse(JSON.stringify(chartConfiguration)),
        'chartdiv'
      );
    }
At this point, your index.html should look like this:
<!DOCTYPE html>
<html lang="en">
<head>
  <meta charset="UTF-8">
  <meta name="viewport" content="width=device-width, initial-scale=1.0">
  <title>amCharts Editor 4 Demo.</title>
  <style type="text/css">
    body {
      text-align: center;
    }
  </style>
  <script src="amcharts4/core.js"></script>
  <script src="amcharts4/charts.js"></script>
  <script>
    let chart;
    let chartConfiguration = {
      "type": "XYChart",
      "data": [{
          "category": "Category #1",
          "value": 4032
      }, {
          "category": "Category #2",
          "value": 724
      }, {
          "category": "Category #3",
          "value": 4015
      }, {
          "category": "Category #4",
          "value": 4232
      }],
      "xAxes": [{
          "type": "ValueAxis",
          "renderer": {
              "maxLabelPosition": 0.98
          }
      }],
      "yAxes": [{
          "type": "CategoryAxis",
          "dataFields": {
              "category": "category"
          },
          "renderer": {
              "grid": {
                  "template": {
                      "type": "Grid",
                      "location": 0
                  }
              },
          }
      }],
      "series": [{
          "type": "ColumnSeries",
          "columns": {
              "template": {
                  "type": "Column",
                  "strokeOpacity": 0,
                  "tooltipText": "{categoryY}\n{valueX}",
                  "tooltipPosition": "pointer"
              }
          },
          "dataFields": {
              "valueX": "value",
              "categoryY": "category"
          },
      }]
    };

    document.addEventListener("DOMContentLoaded", ready);

    function ready() {
      renderChart();
    }

    function renderChart() {
      if (chart) {
        chart.dispose();
      }
      chart = am4core.createFromConfig(
        // IMPORTANT: for performance considerations amCharts performs some
        // operations directly on the passed configuration object. For this
        // reason, in cases when you need the configuration to remain intact
        // after rendering a chart, you should never pass a chart configuration
        // object directly to am4core.createFromConfig and pass a copy instead.
        JSON.parse(JSON.stringify(chartConfiguration)),
        'chartdiv'
      );
    }
  </script>
</head>
<body>
  <h1>amCharts Editor 4 Demo.</h1>
  <div id="chartdiv" style="width: 800px; height: 460px; margin: 20px auto;"></div>
</body>
</html>
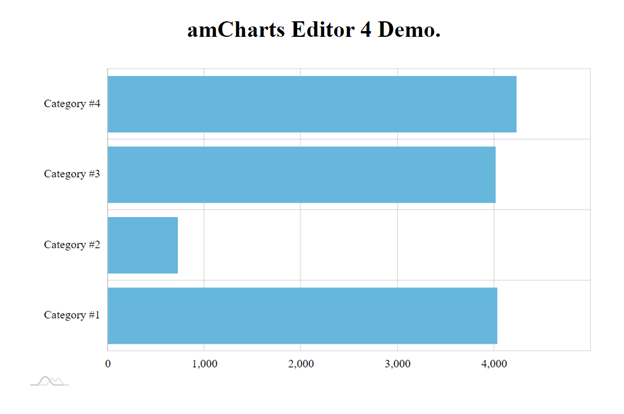
And when loaded, your page should look something like this:
Adding amCharts Editor 4
Now let’s add editor.js script to our <head>:
<script src="editor.js"></script>
Add a variable to hold our editor launcher reference
let launcher;
And a button to launch the editor:
<button onclick="editChart()">edit chart</button>
Now, let’s define that editChart function:
    function editChart() {
      launcher = new am4editor.EditorLauncher();
      launcher.launch(chartConfiguration);
    }
At this point your index.html should look like this:
<!DOCTYPE html>
<html lang="en">
<head>
  <meta charset="UTF-8">
  <meta name="viewport" content="width=device-width, initial-scale=1.0">
  <title>amCharts Editor 4 Demo.</title>
  <style type="text/css">
    body {
      text-align: center;
    }
  </style>
  <script src="amcharts4/core.js"></script>
  <script src="amcharts4/charts.js"></script>
  <script src="editor.js"></script>
  <script>
    let chart;
    let chartConfiguration = {
      "type": "XYChart",
      "data": [{
          "category": "Category #1",
          "value": 4032
      }, {
          "category": "Category #2",
          "value": 724
      }, {
          "category": "Category #3",
          "value": 4015
      }, {
          "category": "Category #4",
          "value": 4232
      }],
      "xAxes": [{
          "type": "ValueAxis",
          "renderer": {
              "maxLabelPosition": 0.98
          }
      }],
      "yAxes": [{
          "type": "CategoryAxis",
          "dataFields": {
              "category": "category"
          },
          "renderer": {
              "grid": {
                  "template": {
                      "type": "Grid",
                      "location": 0
                  }
              },
          }
      }],
      "series": [{
          "type": "ColumnSeries",
          "columns": {
              "template": {
                  "type": "Column",
                  "strokeOpacity": 0,
                  "tooltipText": "{categoryY}\n{valueX}",
                  "tooltipPosition": "pointer"
              }
          },
          "dataFields": {
              "valueX": "value",
              "categoryY": "category"
          },
      }]
    };

    let launcher;

    document.addEventListener("DOMContentLoaded", ready);

    function ready() {
      renderChart();
    }

    function renderChart() {
      if (chart) {
        chart.dispose();
      }
      chart = am4core.createFromConfig(
        // IMPORTANT: for performance considerations amCharts performs some
        // operations directly on the passed configuration object. For this
        // reason, in cases when you need the configuration to remain intact
        // after rendering a chart, you should never pass a chart configuration
        // object directly to am4core.createFromConfig and pass a copy instead.
        JSON.parse(JSON.stringify(chartConfiguration)),
        'chartdiv'
      );
    }

    function editChart() {
      launcher = new am4editor.EditorLauncher();
      launcher.launch(chartConfiguration);
    }

  </script>
</head>
<body>
  <h1>amCharts Editor 4 Demo.</h1>
  <div id="chartdiv" style="width: 800px; height: 460px; margin: 20px auto;"></div>
  <button onclick="editChart()">edit chart</button>
</body>
</html>
And when you click on the “edit chart” button the Editor should open with our chart in it.
What’s left is handling the results of the editing.
Let’s add handlers for the Editor’s close and save event:
    function closeEditor() {
      if (launcher) {
        launcher.close();
      }
    }

    function saveResult(ev) {
      if (ev) {
        chartConfiguration = ev.chartConfig;
        renderChart();
        if (launcher) {
          launcher.close();
        }
      }
    }
And wire them up by updating the editChart function:
    function editChart() {
      launcher = new am4editor.EditorLauncher();
      launcher.addEventListener('close', closeEditor);
      launcher.addEventListener('save', saveResult);
      launcher.launch(chartConfiguration);
    }
And that’s it. Now you should be able to edit the chart on the page and here’s the complete index.html handling this:
<!DOCTYPE html>
<html lang="en">
<head>
  <meta charset="UTF-8">
  <meta name="viewport" content="width=device-width, initial-scale=1.0">
  <title>amCharts Editor 4 Demo.</title>
  <style type="text/css">
    body {
      text-align: center;
    }
  </style>
  <script src="amcharts4/core.js"></script>
  <script src="amcharts4/charts.js"></script>
  <script src="editor.js"></script>
  <script>
    let chart;
    let chartConfiguration = {
      "type": "XYChart",
      "data": [{
          "category": "Category #1",
          "value": 4032
      }, {
          "category": "Category #2",
          "value": 724
      }, {
          "category": "Category #3",
          "value": 4015
      }, {
          "category": "Category #4",
          "value": 4232
      }],
      "xAxes": [{
          "type": "ValueAxis",
          "renderer": {
              "maxLabelPosition": 0.98
          }
      }],
      "yAxes": [{
          "type": "CategoryAxis",
          "dataFields": {
              "category": "category"
          },
          "renderer": {
              "grid": {
                  "template": {
                      "type": "Grid",
                      "location": 0
                  }
              },
          }
      }],
      "series": [{
          "type": "ColumnSeries",
          "columns": {
              "template": {
                  "type": "Column",
                  "strokeOpacity": 0,
                  "tooltipText": "{categoryY}\n{valueX}",
                  "tooltipPosition": "pointer"
              }
          },
          "dataFields": {
              "valueX": "value",
              "categoryY": "category"
          },
      }]
    };

    let launcher;

    document.addEventListener("DOMContentLoaded", ready);

    function ready() {
      renderChart();
    }

    function renderChart() {
      if (chart) {
        chart.dispose();
      }
      chart = am4core.createFromConfig(
        // IMPORTANT: for performance considerations amCharts performs some
        // operations directly on the passed configuration object. For this
        // reason, in cases when you need the configuration to remain intact
        // after rendering a chart, you should never pass a chart configuration
        // object directly to am4core.createFromConfig and pass a copy instead.
        JSON.parse(JSON.stringify(chartConfiguration)),
        'chartdiv'
      );
    }

    function editChart() {
      launcher = new am4editor.EditorLauncher();
      launcher.addEventListener('close', closeEditor);
      launcher.addEventListener('save', saveResult);
      launcher.launch(chartConfiguration);
    }

    function closeEditor() {
      if (launcher) {
        launcher.close();
      }
    }

    function saveResult(ev) {
      if (ev) {
        chartConfiguration = ev.chartConfig;
        renderChart();
        if (launcher) {
          launcher.close();
        }
      }
    }

  </script>
</head>
<body>
  <h1>amCharts Editor 4 Demo.</h1>
  <div id="chartdiv" style="width: 800px; height: 460px; margin: 20px auto;"></div>
  <button onclick="editChart()">edit chart</button>
</body>
</html>
Useful links: