Comparing stock indices (using external data)
This demo simulates a life-like Stock market chart historical chart. The data displayed in this chart is very realistic to demonstrate the capabilities of the JavaScript Stock Chart.
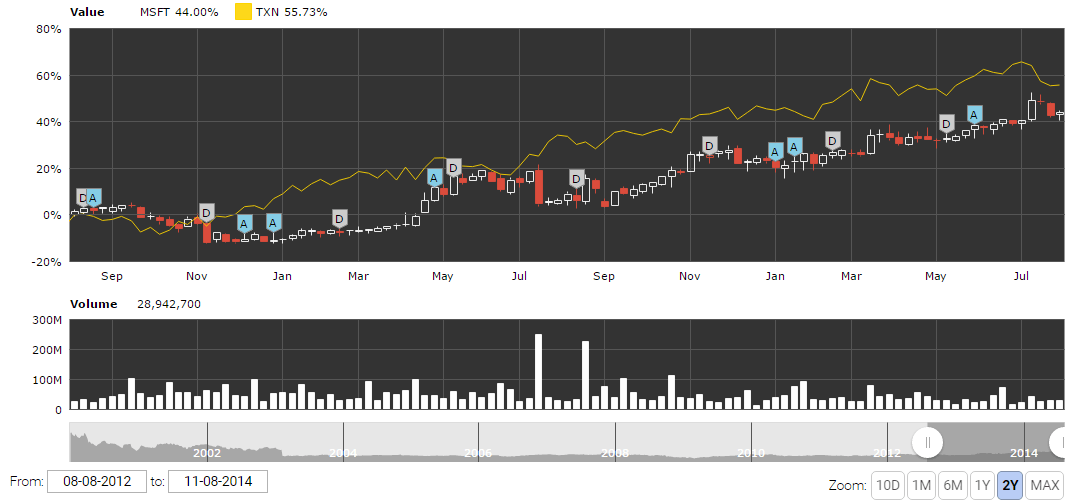
Comparison of the indices
Showcased here is how the comparison of the two indices (coming from two separate data sources – data sets) works. The main selected data set (MSFT) is shown as a Cadlestick graph to depict Open, High, End and Close values. The compared data set (TXN) is displayed as a line graph to compare the dynamics of the two indices.
The chart also contains an additional Volume indicator for main data set.
Stock events
Main data set also displays key events like Dividends or Analyst opinion updates as pins on the chart. Events can take various forms, display additional rollover information. Take a look at this demo for more examples of Stock Event usage.
External data
All of the data for this chart, including stock market data and events, are loaded on chart load from CSV files resembling Yahoo Finance structure. The chart uses our own Data Loader plugin to automatically load and parse external data. Click the below links to view the structure of those sample CSV files:
Demo source