Line Chart Adding Data Every Second
Displaying charts for live data is a common task these days and amCharts is here to help you do it in style.
Key implementation details
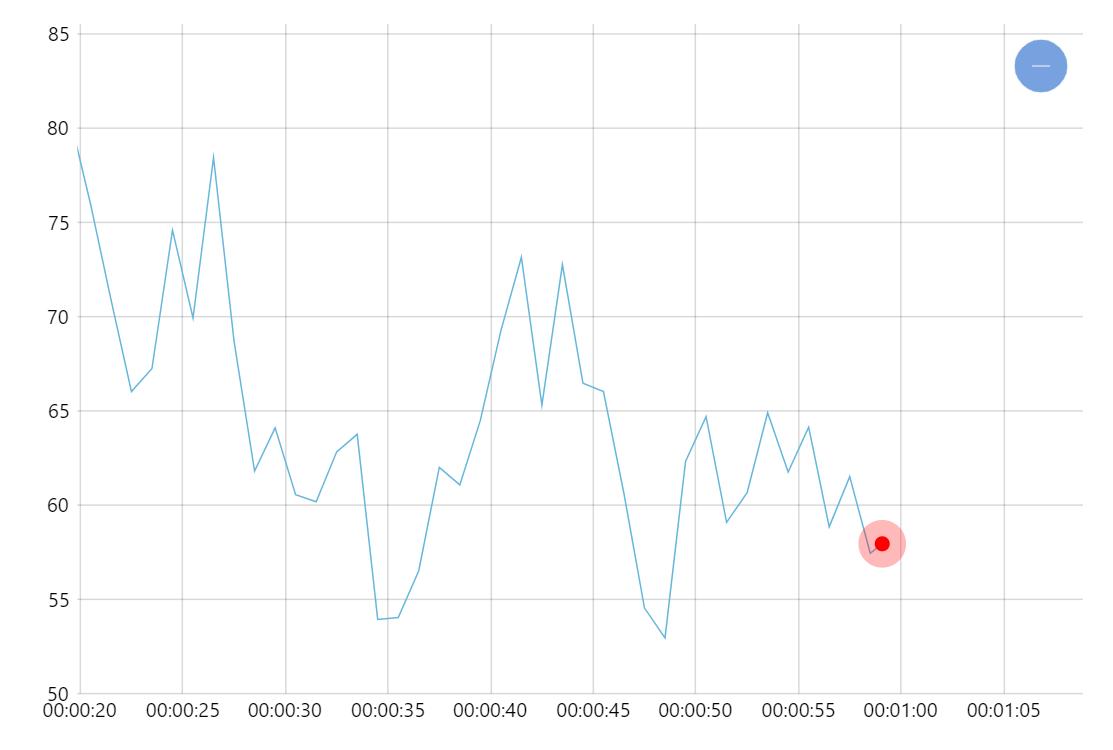
We add a new data item to the series data as we get it and remove the oldest one. The amCharts Charts library takes care of the rest of the core functionality. One thing we can do to spice up the chart and guide viewers attention is animating the appearance of that new value and tracking the trend in data. Charts library has all the tools for that.
Related tutorials
Build this chart with AI
The prompt below can be used to build this chart with AI. For best coding results, use the most advanced AI models, like Claude Opus 4.6 and GPT-5.3-Codex. For more info and tips, check out amCharts AI docs.
Create a real-time line chart starting with 50 data points that adds a new point every second while removing the oldest, maintaining a rolling window. Display a pulsing animated red circle bullet on the latest data point. Animate each new point smoothly into view. Include an XY cursor with tooltips, pan/zoom on both axes, and entrance animation. Use amCharts 5 library.
Demo source