Highlighting Line Chart Series on Legend Hover
Charts with multiple series are great to get a high-level view of data but could be hard to read when you want to focus on data in one series. Selecting the series in the legend and highlighting its respective graph is a perfect way to solve this issue.
Key implementation details
We handle the pointerover event on the Legend and get the underlying series from its data item. Then we just go through the series of the chart and highlight our selected series by increasing its stroke width, then dim all the other series. On pointerout we restore the view.
Related tutorials
Build this chart with AI
The prompt below can be used to build this chart with AI. For best coding results, use the most advanced AI models, like Claude Opus 4.6 and GPT-5.3-Codex. For more info and tips, check out amCharts AI docs.
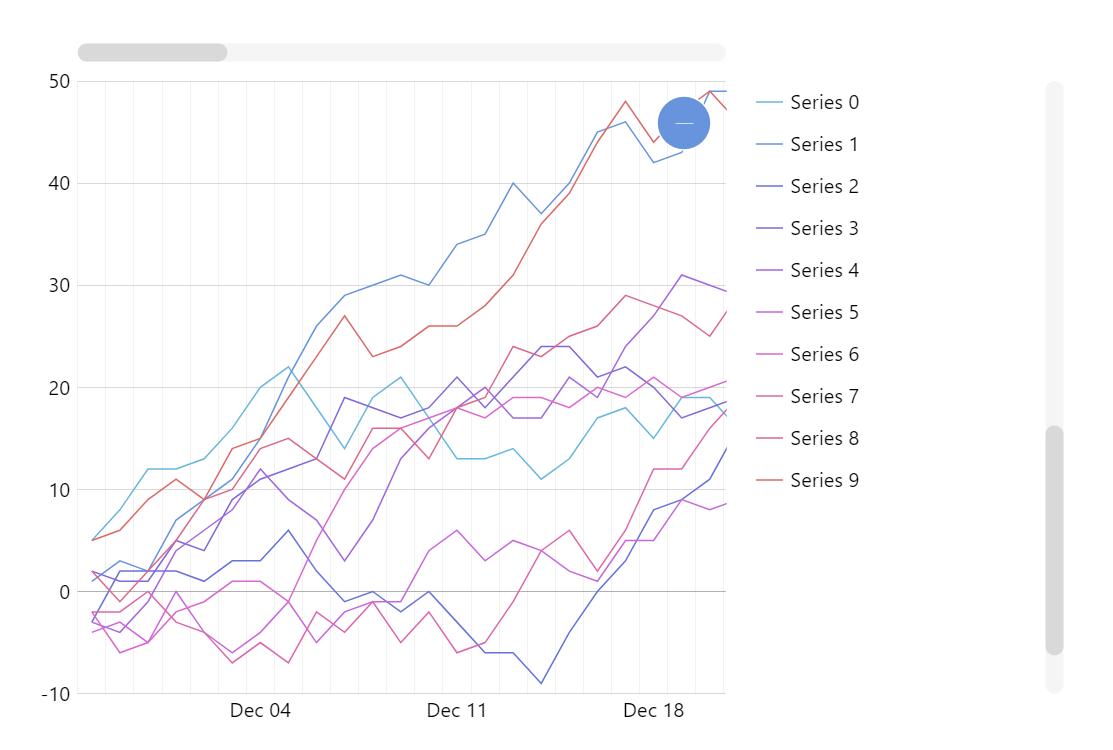
Create a multi-series line chart with 10 series, each containing 100 daily data points. Add a legend that, on hover, dims all other series and thickens the hovered one for emphasis. Include pan/zoom on both axes, horizontal and vertical scrollbars, an XY cursor with horizontal tooltips, minor grid lines, and staggered entrance animation. Use amCharts 5 library.
Demo source