Selecting and Marking Multiple Ranges
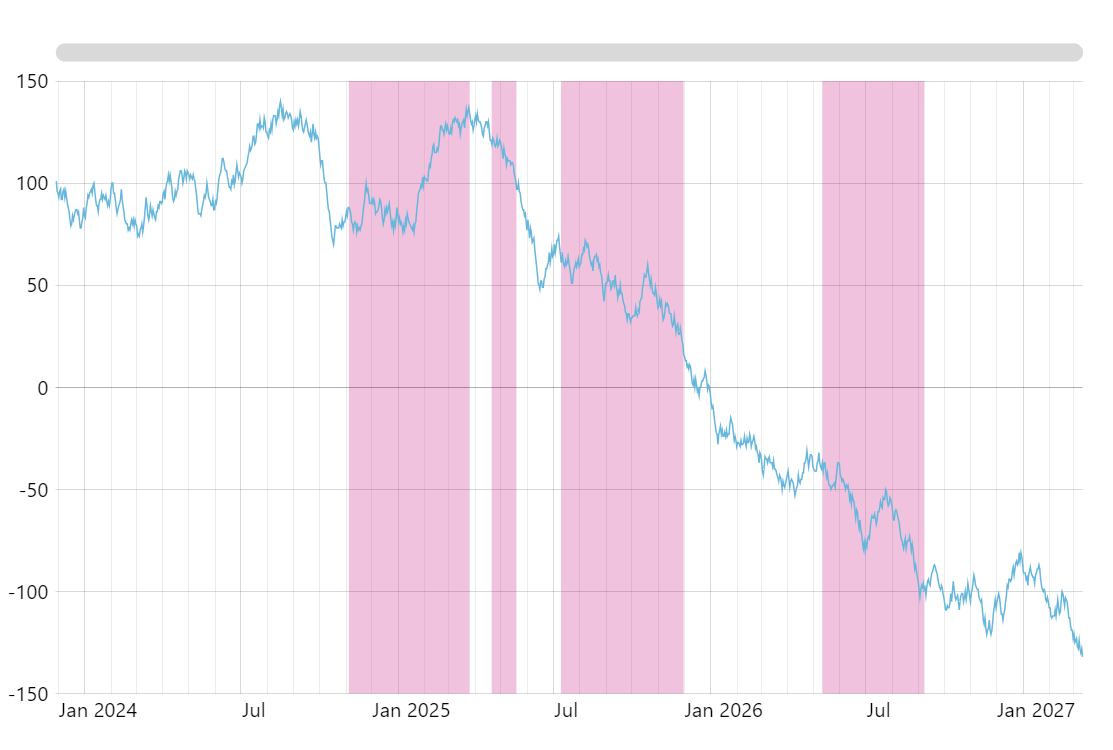
Click and drag on plot area to select a range on a chart. Chart creates an axis range in the place of a selection and also checks if a new range is not overlapping with previously created.
Key implementation details
We use cursor events here (selectstarted and selectended) to track selection start and end positions and then transform these positions to values using axis’ positionToValue() method. Then create (or adjust) axis ranges based on these values.
Related tutorials
Build this chart with AI
The prompt below can be used to build this chart with AI. For best coding results, use the most advanced AI models, like Claude Opus 4.6 and GPT-5.3-Codex. For more info and tips, check out amCharts AI docs.
Create a line chart with 1,200 daily data points where users can click and drag to select date ranges, creating semi-transparent colored overlay regions. Include overlap detection to prevent new selections from overlapping existing ones. Add a horizontal scrollbar, tooltips, and entrance animation. Use amCharts 5 library.
Demo source