Professional Candlesticks
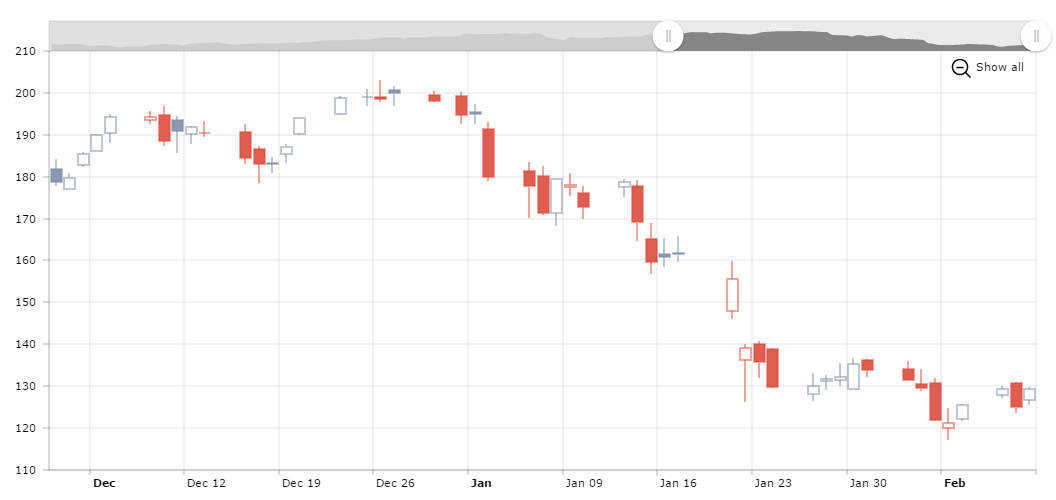
Stock market professionals are used to analyse stocks using a bit different candlesticks than the ones most of us know. The above chart illustrates this kind of candlesticks. The main difference is this – empty candle is shown when open value of the same date is lower than close value (price increased during the single period – day, week, month, etc.). And the color indicates if price dropped or risen comparing to a previous period – if current item’s close price is lower than previous period close price, the candle will be red. Otherwise – blue (or some other colors, you are free to choose). To enable this feature, you must simply set proCandlesticks property of a graph to true.
Demo source