Simple Pie Chart
Pie chart is used to represent data series as part of the whole. Each slice in a pie chart represents a data item proportionally to the sum of all the items in the series. Pie chart is one of the most widely used chart types but is widely criticized as its difficult for people to compare items in this circular shape.
Pie is a series
Pie is a serial chart. Each collection of slices is a Pie series.
Intelligently laid out labels
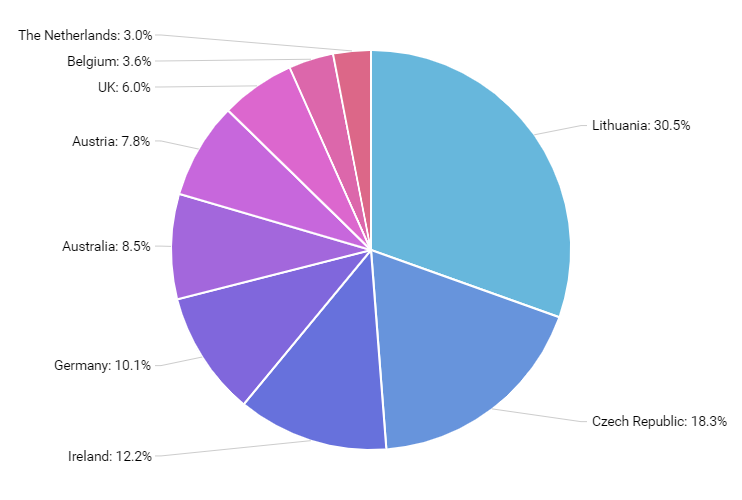
Slice labels are intelligently laid out in columns, so they do not overlap and are readable.
Should you want labels positioned circularly around pie, just set series alignLabels to false.
Demo source