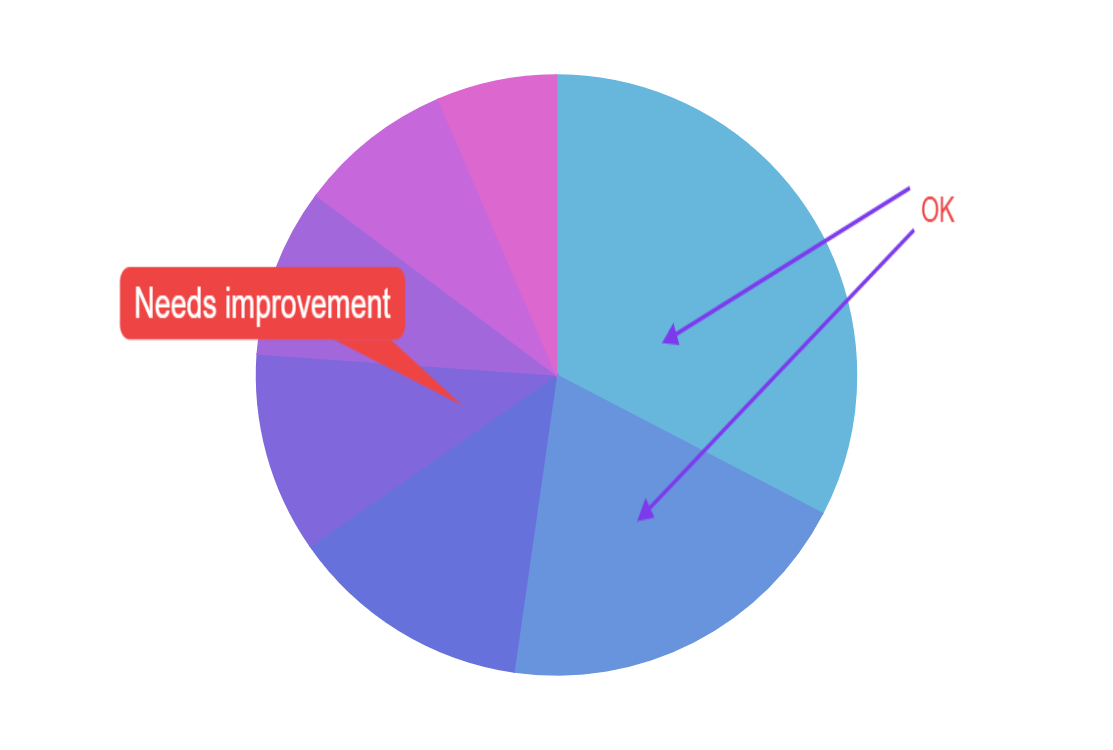
Annotating Charts
Exporting plugin includes Annotator tool, which can be used to annotations to any chart using simple user interface.
Related tutorials
Build this chart with AI
The prompt below can be used to build this chart with AI. For best coding results, use the most advanced AI models, like Claude Opus 4.6 and GPT-5.3-Codex. For more info and tips, check out amCharts AI docs.
Create a donut pie chart (with a partial ring, not a full circle) showing data for several countries (e.g., Lithuania 501.9, Czechia 301.9, Ireland 201.1, Germany 165.8, Australia 139.9, Austria 128.3, UK 99). Hide slice labels and ticks for a clean look. Animate the entrance. Enable the amCharts Exporting plugin with an Annotator tool so that users can toggle annotation mode from the export menu, then draw callout markers, arrow markers, and text markers directly on the chart. Use amCharts 5 library.
Demo source