Bubble Chart with Pie Bullets
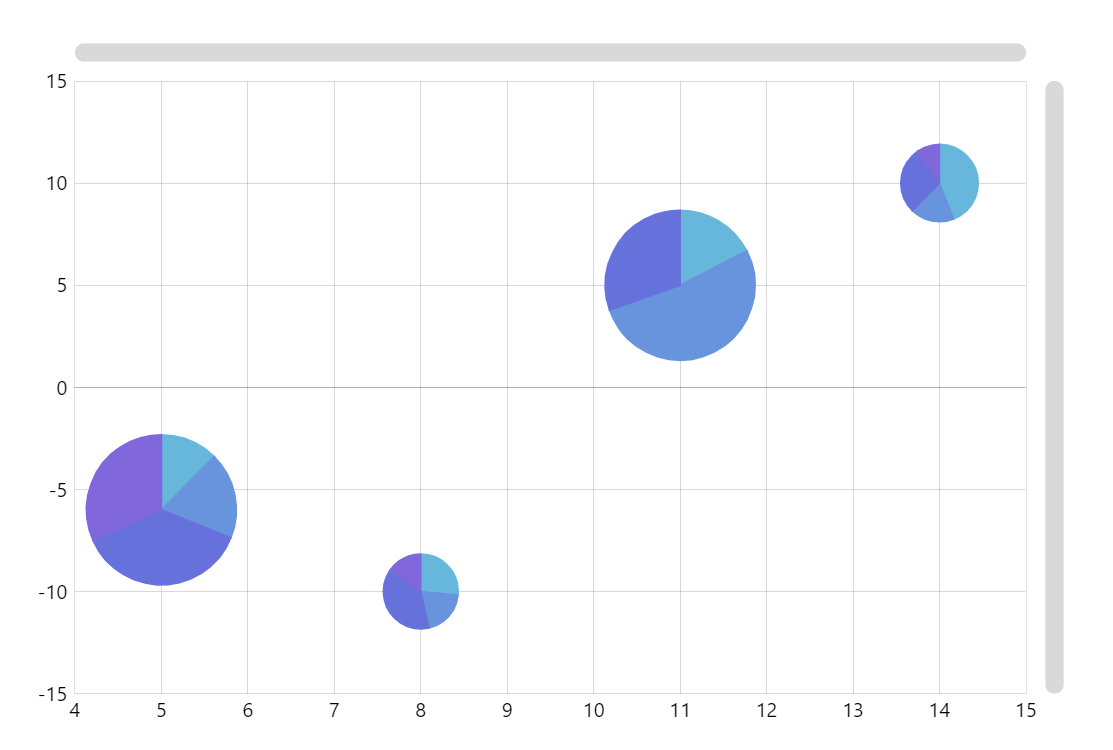
This demo shows a bubble chart uses PieChart elements as bubbles as well as heat rules to size them according to their value.
Related tutorials
Build this chart with AI
The prompt below can be used to build this chart with AI. For best coding results, use the most advanced AI models, like Claude Opus 4.6 and GPT-5.3-Codex. For more info and tips, check out amCharts AI docs.
Create an XY scatter plot where each data point is represented as a mini pie chart instead of a simple marker. Display four data points, each with X/Y coordinates and nested categorical breakdown data. Scale pie chart sizes based on data values so that larger values produce larger pies. Hide pie chart labels for clarity. Connect points with a subtle line. Enable pan on both axes, mouse wheel zoom, pinch zoom, and add scrollbars. Show tooltips with x, y, and value. Animate on load. Use amCharts 5 library.
Demo source