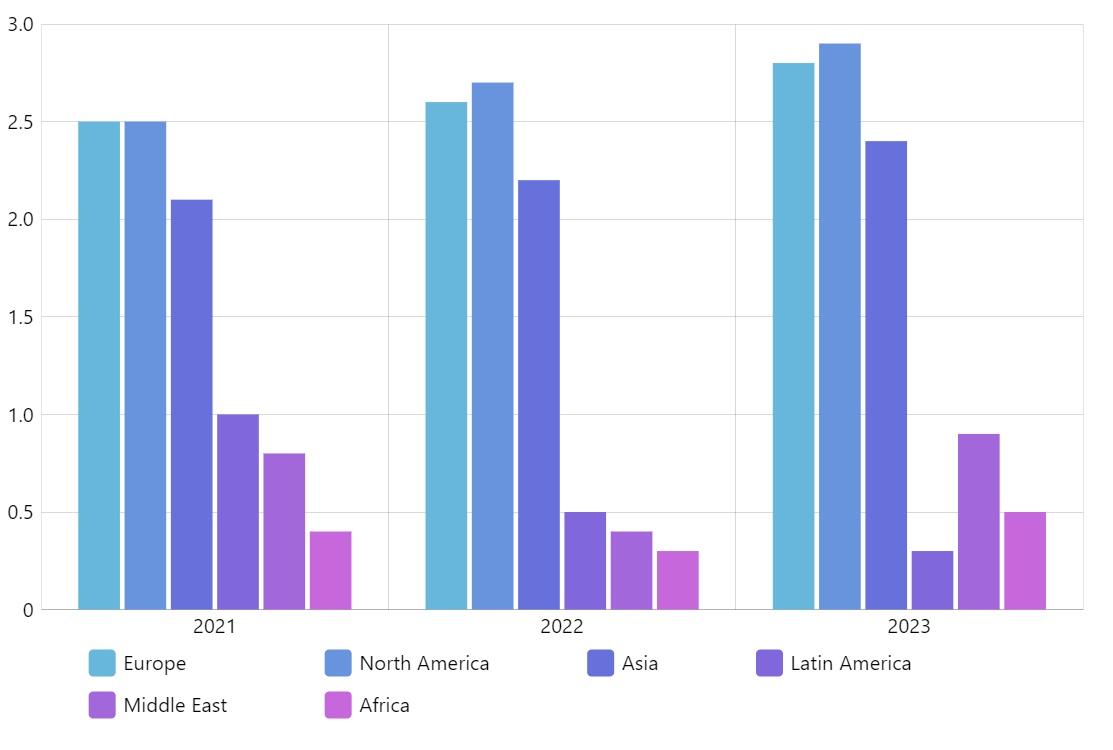
Clustered Column Chart
Clustered Column Chart is the default column chart behavior where values from all series are displayed next to each other at the same category axis value.
Key implementation details
In this demo we emphasize the “clusters” by adding margins around them. We do this by setting cellStartLocation and cellEndLocation on the horizontal axis renderer (AxisRendererX). We set them to 0.1 and 0.9 respectively, resulting in 10% margins on both sides.
Related tutorials
Build this chart with AI
The prompt below can be used to build this chart with AI. For best coding results, use the most advanced AI models, like Claude Opus 4.6 and GPT-5.3-Codex. For more info and tips, check out amCharts AI docs.
I want to compare all continents (except Antarctica) side by side for each year from 2023 to 2026. Years on the X axis, one colored column per continent. Add a legend at the bottom and show values on hover. Make up realistic population data in millions. Use amCharts 5 library.
Demo source