Control Chart
This demo shows how XYChart can be used to create a Control Chart (also known as Shewhart chart).
Key implementation details
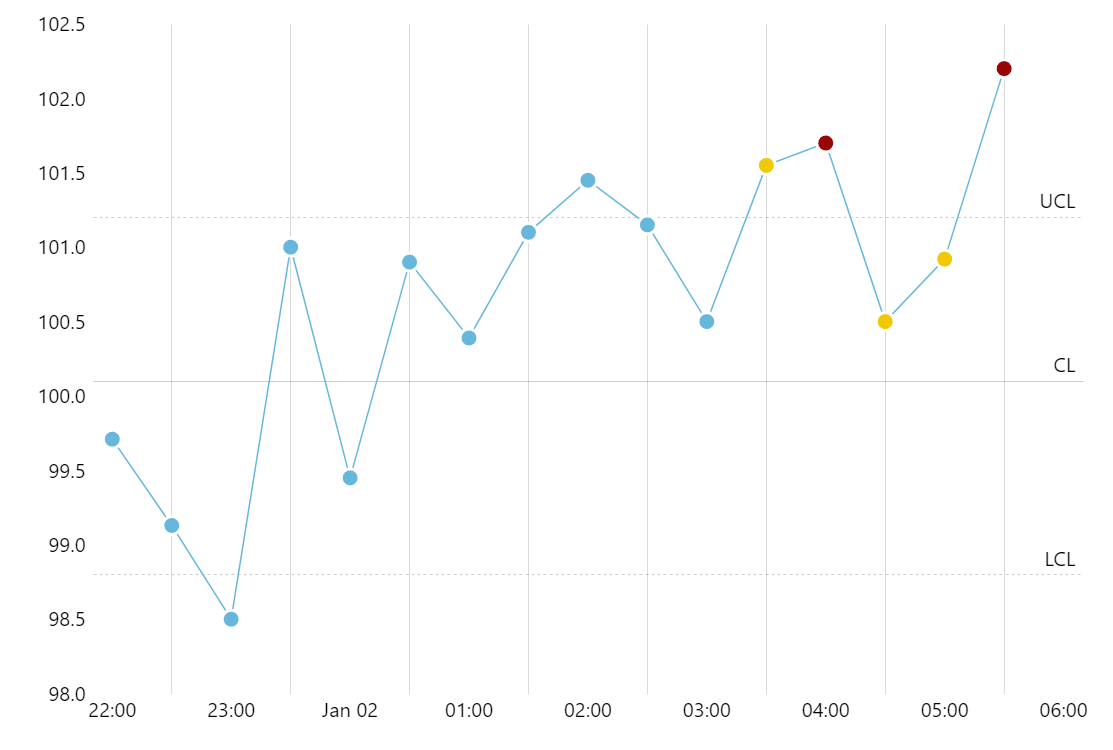
We implement central line (CL) and upper and lower control limits using the axis range feature of amCharts XY Chart. Bullet color is set based on the data item.
Related tutorials
Build this chart with AI
The prompt below can be used to build this chart with AI. For best coding results, use the most advanced AI models, like Claude Opus 4.6 and GPT-5.3-Codex. For more info and tips, check out amCharts AI docs.
Create a control chart with 16 data points at 30-minute intervals. Display three horizontal reference lines: dashed upper control limit (UCL), solid center line (CL), and dashed lower control limit (LCL). Color data point bullets conditionally: blue for normal, yellow for warning, and dark red for violations. Include pan/zoom on the X-axis, XY cursor with vertical line only, tooltips, and entrance animation. Use amCharts 5 library.
Demo source