Divergent Lines
This demo shows how an XYChart can combine several smoothed LineSeries to depict projections using divergent lines. Divergent lines refer to a set of lines that originate from a common point and gradually spread or move apart from each other as they extend further. These lines exhibit a diverging pattern, creating increasing space or distance between them.
Implementation details
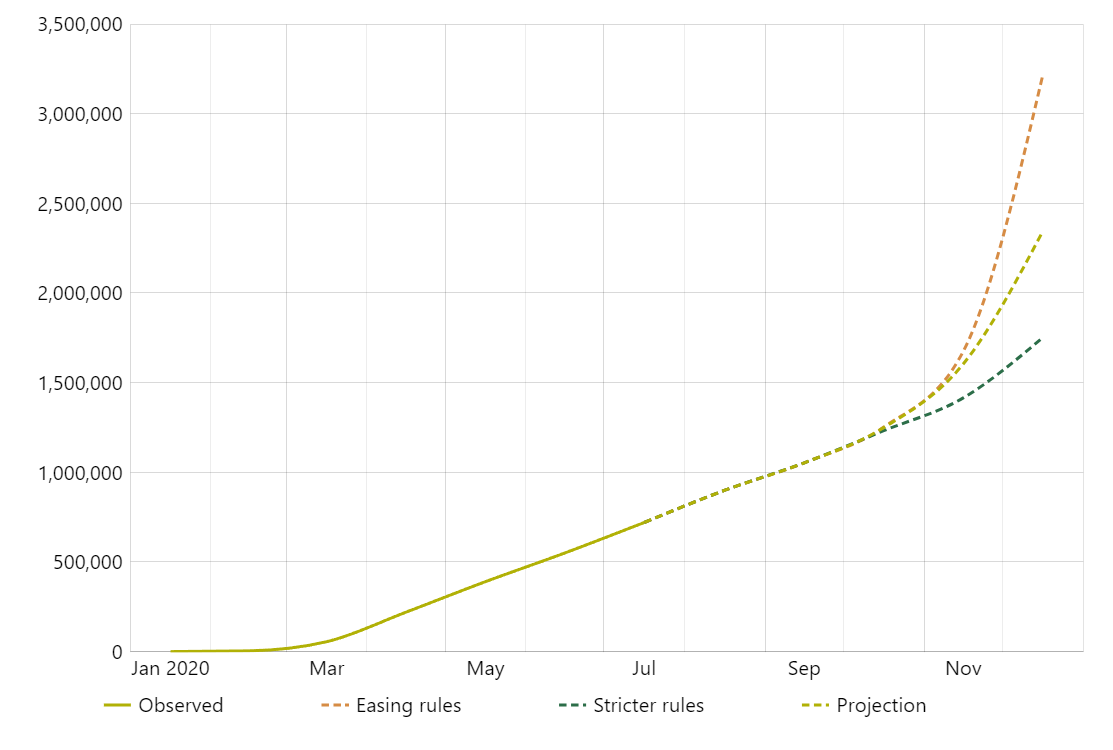
We created 4 smoothed line series here: 1 for the observed value range (solid line) and 3 for the projections (dashed). As projection series start where the observed series ends, we gete a continuous looks we are after.
Related tutorials
Build this chart with AI
The prompt below can be used to build this chart with AI. For best coding results, use the most advanced AI models, like Claude Opus 4.6 and GPT-5.3-Codex. For more info and tips, check out amCharts AI docs.
Create a smoothed line chart with four series showing monthly data for 2020. Display one solid line for observed data through July, then three dashed lines diverging from that point representing different scenarios ('Easing rules', 'Stricter rules', 'Projection'). Each series uses a distinct color. Include a legend, tooltips, pan/zoom on both axes, and entrance animation. Use amCharts 5 library.
Demo source