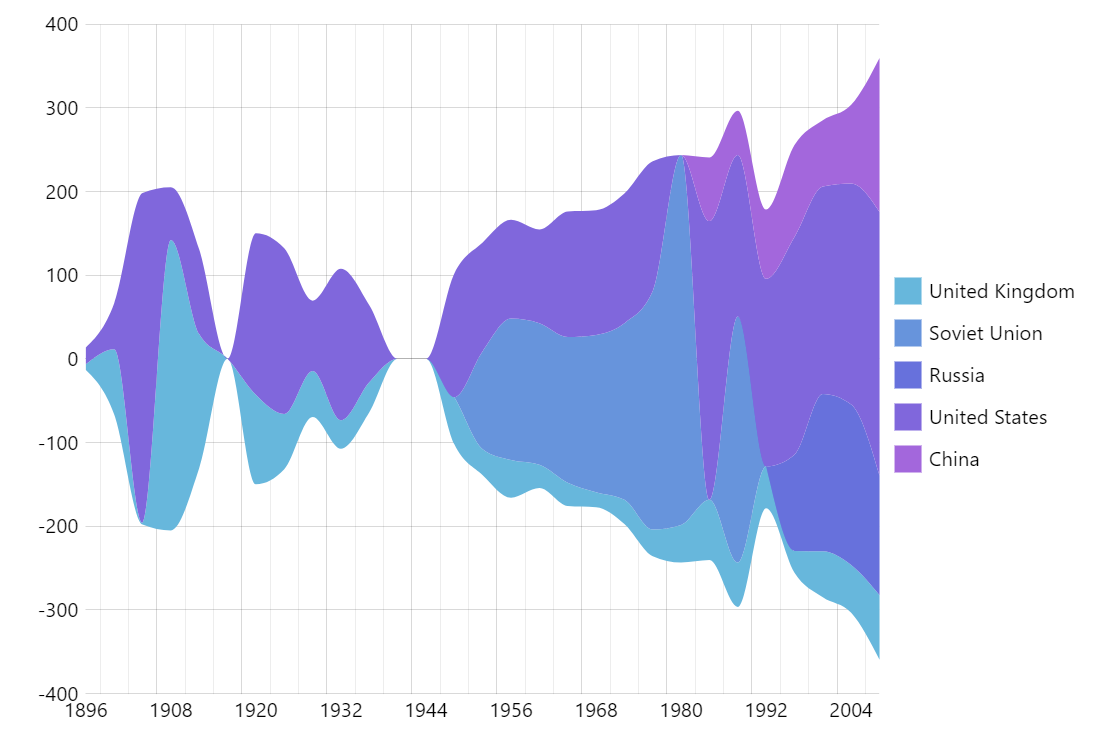
Stream / ThemeRiver Chart
The ThemeRiver or Stream chart is a type of flow graph that shows changes of events (themes) over time.
Key implementation details
We use SmoothedXLinesSeries for the series. We set fillOpacity on it to 1 to make it an area chart. Then we process the data to create valueYField and openValueYField data fields holding ajdusted values for the stacking effect.
Related tutorials
Build this chart with AI
The prompt below can be used to build this chart with AI. For best coding results, use the most advanced AI models, like Claude Opus 4.6 and GPT-5.3-Codex. For more info and tips, check out amCharts AI docs.
Create a stream/ThemeRiver chart displaying Olympic medal counts for five countries across Olympic years 1896-2008. Use smoothed flowing stacked areas centered symmetrically around a zero baseline. Each country has its own color with no borders between areas. Add a vertical legend on the left, XY cursor with zoom/pan, horizontal tooltips with country, year, and count, and entrance animation. Use amCharts 5 library.
Demo source