Live Data
Displaying pre-defined data in the most beautiful and readable way is great but amCharts lets you visualize live constantly updating data just as well.
Key implementation details
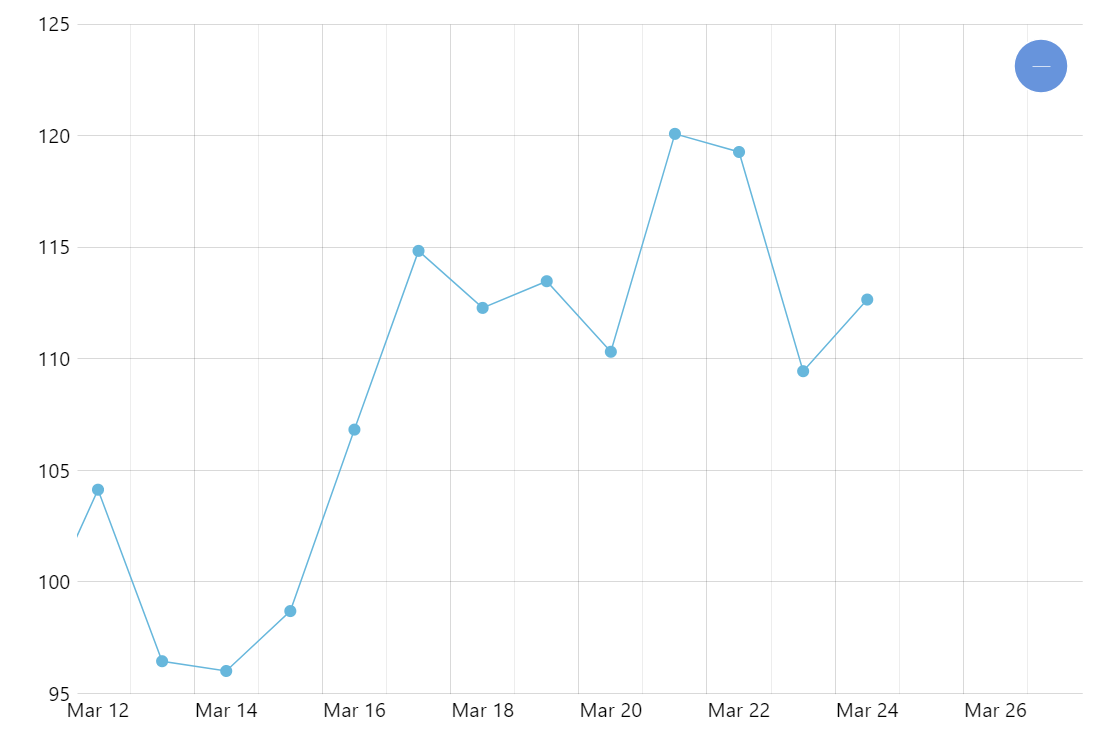
In this example we emulate new data being added every second. We just add a new data item to our series.data and remove the oldest one. For maximum effect we animate the new data item by moving both its X and Y values from the previous items location to the actual location of the newly added data.
Related tutorials
Build this chart with AI
The prompt below can be used to build this chart with AI. For best coding results, use the most advanced AI models, like Claude Opus 4.6 and GPT-5.3-Codex. For more info and tips, check out amCharts AI docs.
Create a live-updating line chart that loads historical data then adds a new data point every second while removing the oldest, maintaining a rolling window. Display circular markers at each point with smooth animated transitions for new data. Include pan on both axes, mouse-wheel zoom on the X-axis, XY cursor with horizontal tooltip, and entrance animation. Use amCharts 5 library.
Demo source