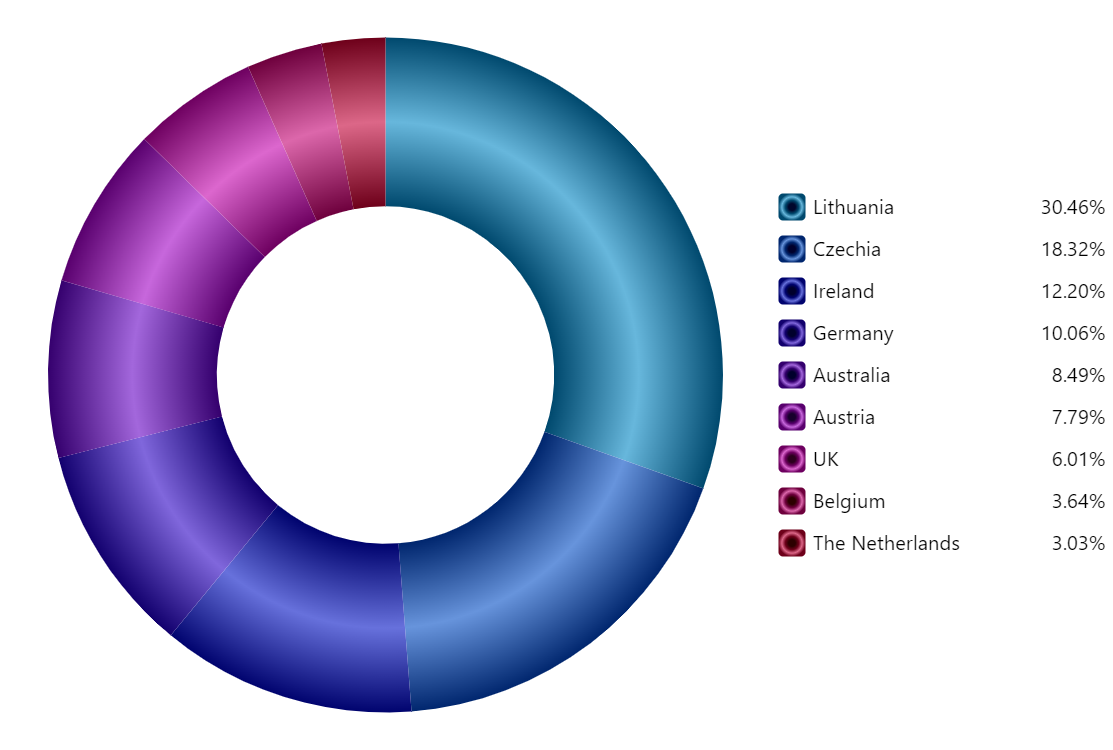
Donut with Radial Gradient
Radial gradient modifiers
amCharts 5 can either use full-fledged gradients or “gradient modifiers” as a fill for just about anything.
A gradient modifier is an easy way to automatically create gradients out of the plain fill colors, for an instant stunning looks of the charts.
Legend
Adding legend to the chart is super easy: you just set legend property of the chart with a new instance of Legend.
The chart will take car of the rest, creating a legend with items for each slice and toggling/hover functionality.
Build this chart with AI
The prompt below can be used to build this chart with AI. For best coding results, use the most advanced AI models, like Claude Opus 4.6 and GPT-5.3-Codex. For more info and tips, check out amCharts AI docs.
Create a donut chart with gradient fills on each slice. Display sales data for nine countries (Lithuania 501.9, Czechia 301.9, Ireland 201.1, Germany 165.8, Australia 139.9, Austria 128.3, UK 99, Belgium 60, The Netherlands 50). Apply gradient shading to create a sense of depth and dimension on each slice. No borders or slice labels. Position a vertical legend on the right side showing country names and sales values. Legend items should support toggling and hover functionality. Include a smooth animated sequential entrance on load. Use amCharts 5 library.
Demo source