Drill-down Congressional Map
This demo uses a state map of the USA on its first level.
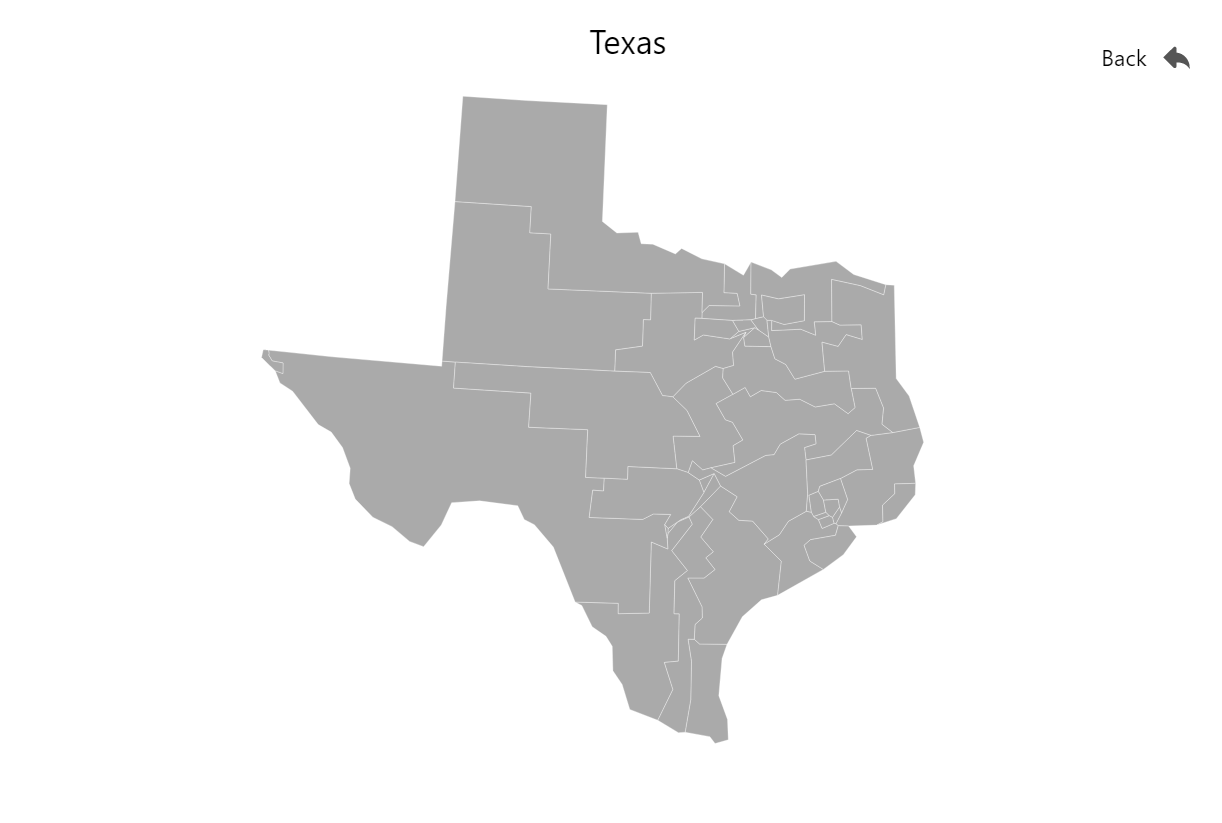
Upon click of the state, it dynamically loads Congressional Districts map of that state, as well as transitions to it.
Related tutorials
Build this chart with AI
The prompt below can be used to build this chart with AI. For best coding results, use the most advanced AI models, like Claude Opus 4.6 and GPT-5.3-Codex. For more info and tips, check out amCharts AI docs.
Create a two-level drill-down map of the United States. At the first level, display US states in gray with a distinct hover color. When a user clicks a state, zoom into it and load that state's congressional district boundaries. Toggle visibility between the state view and the district view during drill-down. Display a dynamic title showing 'United States' or the selected state name. Add a styled back button with an arrow icon that appears after drilling down to restore the initial view. Show polygon name tooltips on hover. Use the Albers USA projection. Use amCharts 5 library.
Demo source