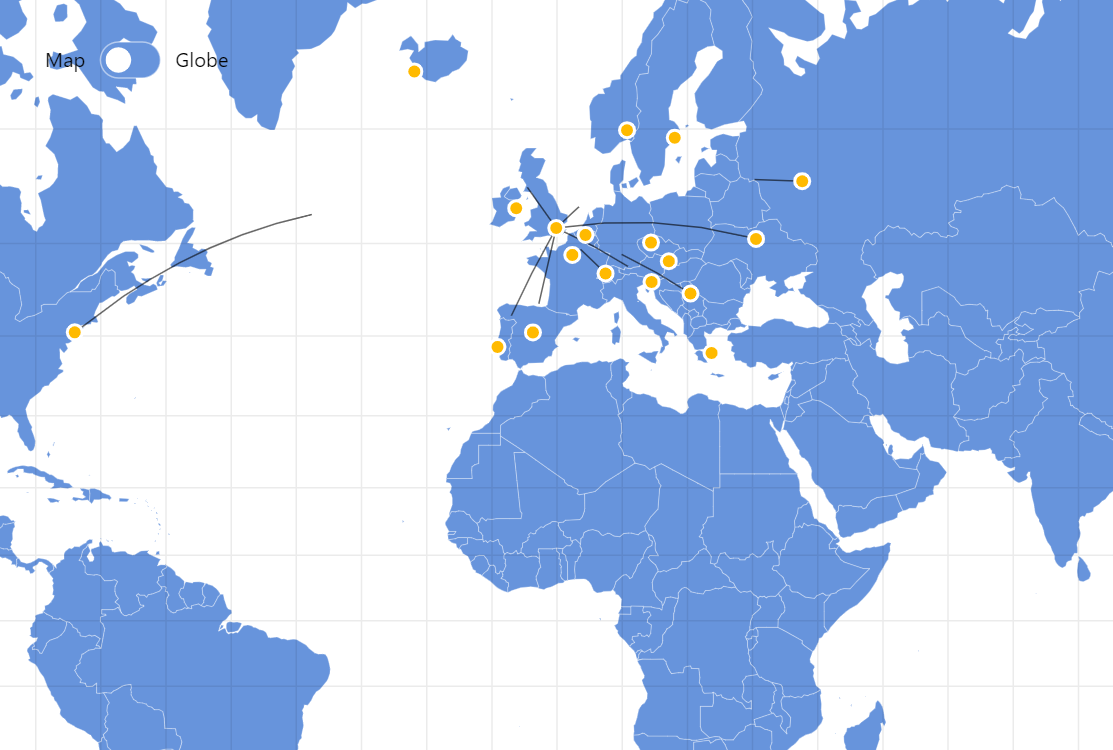
Map with Animated Lines
Connecting points on a map is a typical way to display relationships between these points. When you want to display the direction of that relationship you can either use arrows, like in the Maps with Curved Lines demo, or you can use animation like we are doing here.
Key implementation details
We setup our regular static MapLineSeries to act as our guides and set strokeOpacity on them to 0 (they are only used as guides). Then we add bullets based on our cities (again, invisible) using MapPointSeries. Finally, we animate these bullets along their respective lines and use those bullet positions as end-point data items for our animated lines.
Related tutorials
Build this chart with AI
The prompt below can be used to build this chart with AI. For best coding results, use the most advanced AI models, like Claude Opus 4.6 and GPT-5.3-Codex. For more info and tips, check out amCharts AI docs.
Create an interactive map centered on London showing animated data flow lines connecting London to 10 or more European destination cities. Place golden circle markers with white borders at each city position with name tooltips. Show animated lines flowing from London to each destination, producing a perpetual flowing traffic effect that loops continuously, with animation speed proportional to geographic distance. Include a toggle button to switch between a flat map and a 3D globe view, adjusting pan controls accordingly. Show a grid overlay for reference. Auto-zoom to London. Apply smooth entrance animations. Use amCharts 5 library.
Demo source