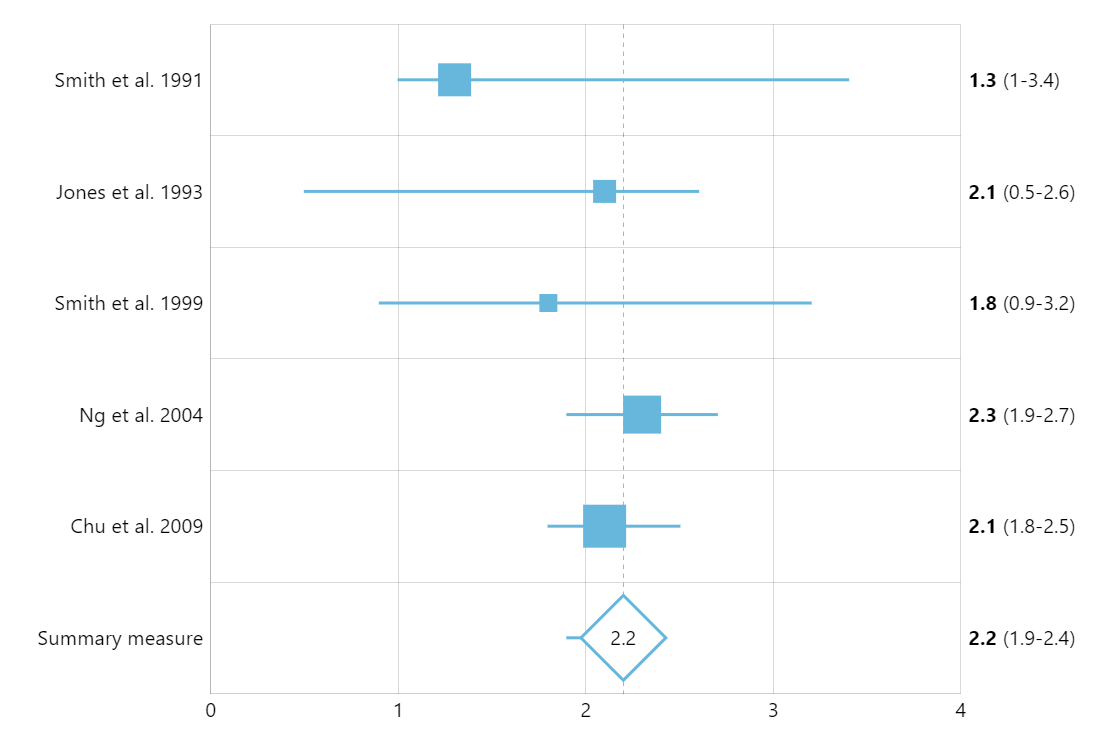
Forest Plot
This demo shows a basic Forest Plot chart.
This relatively simple demo utilizes a bunch of amCharts 5 concepts: template fields, heat rules, axis ranges, and adapters.
Related tutorials
- Axis ranges (used to display vertical comparison guide)
- Heat rules (used to size bullets based on their value)
- Adapters (used to dynamically update content of axis labels)
- Template fields (used to override bullet settings via data)
Build this chart with AI
The prompt below can be used to build this chart with AI. For best coding results, use the most advanced AI models, like Claude Opus 4.6 and GPT-5.3-Codex. For more info and tips, check out amCharts AI docs.
Create a forest plot for meta-analysis. Show five studies (e.g., Smith et al. 1991 through Chu et al. 2009) plus a summary measure on a vertical category axis. Each study displays a point estimate with horizontal confidence interval lines and a square marker sized proportionally to the sample size. The summary measure displays as a rotated diamond shape with white fill. Add a vertical dashed reference line at the summary effect value. Include two vertical axes: the left showing study labels and the right showing formatted statistics with measurement and confidence interval bounds. Add a crosshair cursor and tooltips with formatted values. Disable panning. Animate with staggered fade-in. Use amCharts 5 library.
Demo source