Funnel Chart
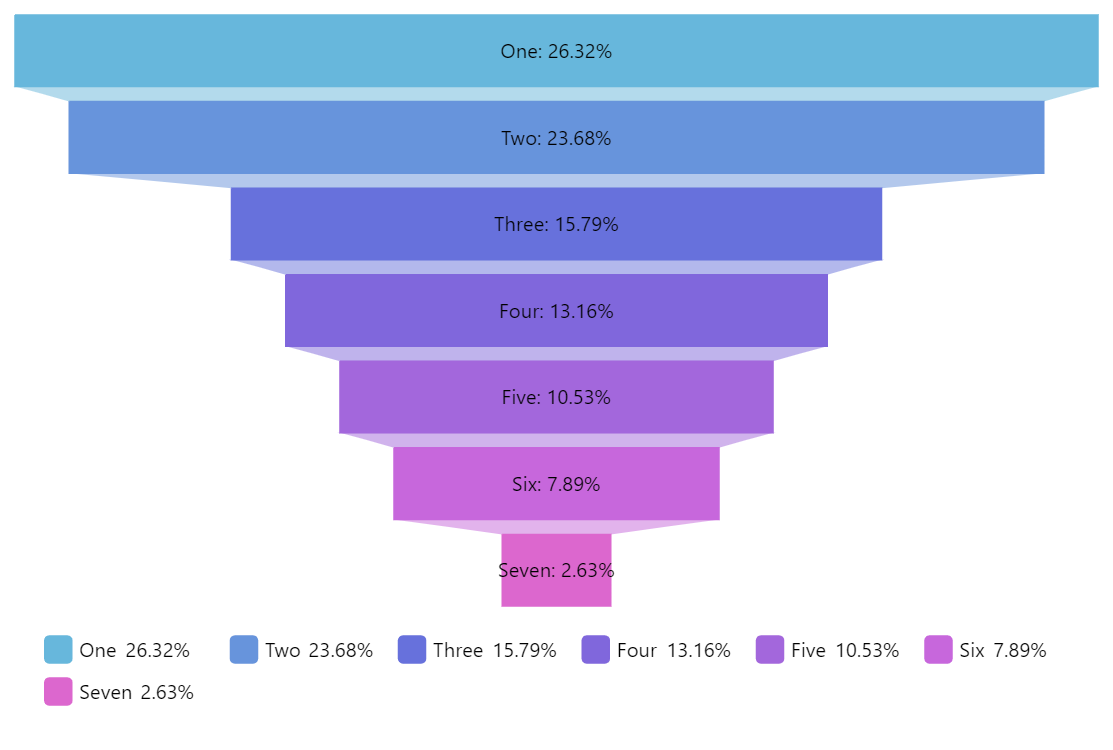
Funnel Chart is used to display how the data is filtered down through the steps of some process or processes. Each step represents a portion of the total going through it. The top (head) of each step represents the incoming value and the bottom (neck) the output value after some sort of filtering.
Related tutorials
Build this chart with AI
The prompt below can be used to build this chart with AI. For best coding results, use the most advanced AI models, like Claude Opus 4.6 and GPT-5.3-Codex. For more info and tips, check out amCharts AI docs.
Create a vertical funnel chart displaying seven categories (One through Seven) with decreasing values from 10 to 1, each trapezoid shape narrowing progressively to visualize data filtering through sequential process steps. Add a clickable legend positioned centrally below the chart. Include an interactive slider control labeled 'Bottom ratio' that lets users adjust how much the bottom of the funnel narrows, dynamically updating the chart. Use the Animated theme. The chart should be 500px tall at full width. Use amCharts 5 library.
Demo source