Horizontal Arc Diagram
An arc diagram is a data visualization technique that represents relationships between entities. It consists of a series of arcs or lines connecting the entities. Arc diagrams are often used to visualize social networks, genealogical relationships, or connections between elements in a complex system. By displaying the connections in a visually intuitive way, arc diagrams help uncover patterns and insights within the data, facilitating analysis and understanding.
Related tutorials
Build this chart with AI
The prompt below can be used to build this chart with AI. For best coding results, use the most advanced AI models, like Claude Opus 4.6 and GPT-5.3-Codex. For more info and tips, check out amCharts AI docs.
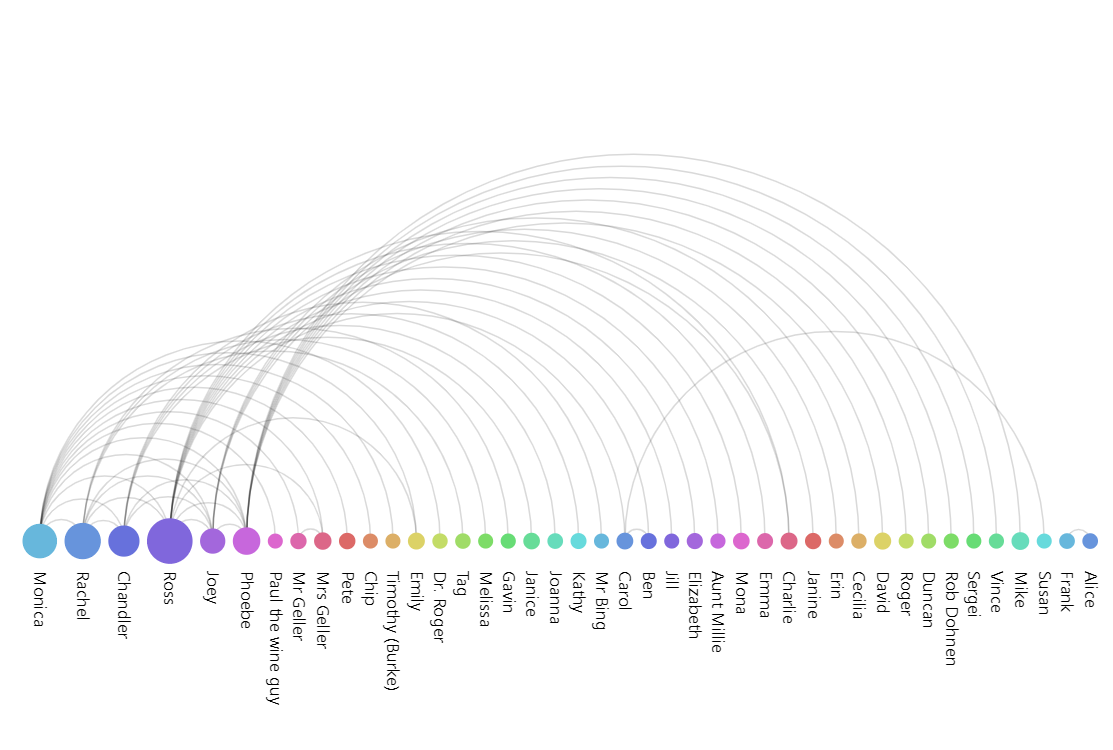
Create a horizontal arc diagram visualizing character interactions from the TV show Friends. Define connections between Monica, Rachel, Chandler, Ross, Joey, and Phoebe with numeric values (1-80) representing interaction strength. Arrange character nodes horizontally with names as vertical labels. Size node circles proportionally to total connection strength. Connect nodes with curved arcs whose thickness corresponds to interaction values. Place labels centered within larger nodes and rotate labels for smaller nodes. Use the Animated theme. The chart should be 500px tall at full width. Use amCharts 5 library.
Demo source