Vertical Arc Diagram
An arc diagram is a powerful visual representation that depicts relationships and connections between entities. It employs curved lines or arcs to illustrate these connections. Arc diagrams are extensively used in various fields, such as network analysis, biology, and information visualization. By presenting complex relationships in a simplified and intuitive manner, arc diagrams enable researchers and analysts to identify patterns, explore interdependencies, and gain valuable insights from the data at hand.
Related tutorials
Build this chart with AI
The prompt below can be used to build this chart with AI. For best coding results, use the most advanced AI models, like Claude Opus 4.6 and GPT-5.3-Codex. For more info and tips, check out amCharts AI docs.
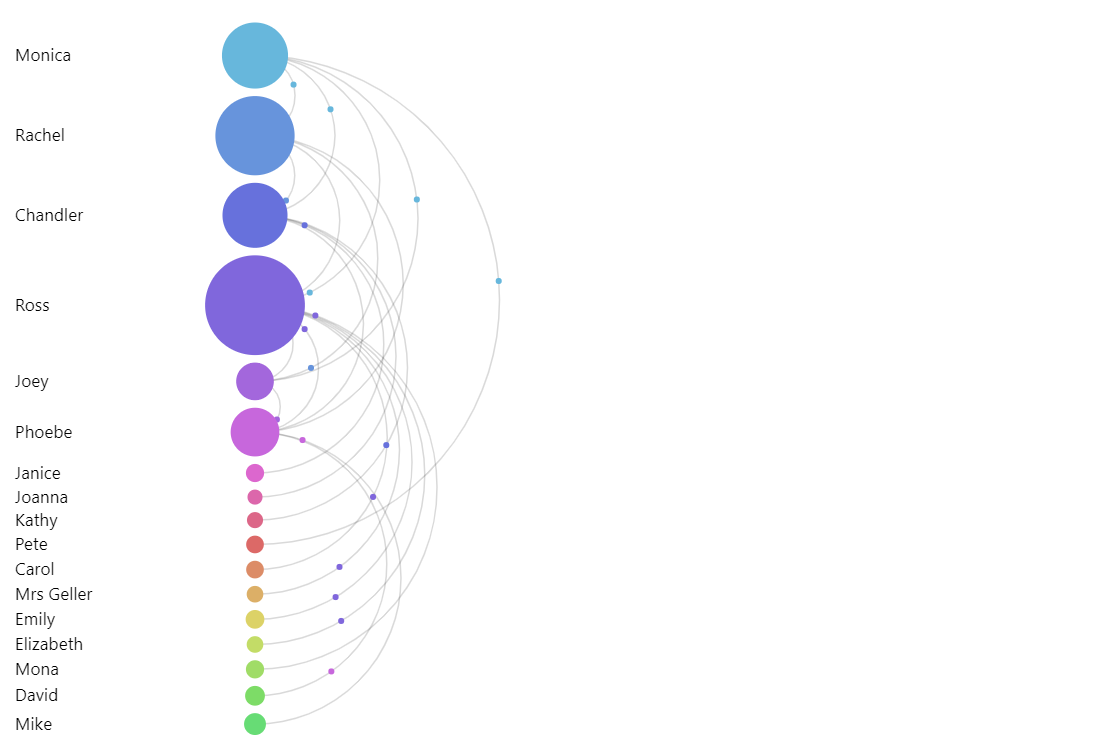
Create a vertical arc diagram visualizing 23 character relationships from the TV show Friends. Define connections with source, target, and value fields (e.g., Monica to Chandler = 63). Arrange character nodes vertically with labels. Connect nodes with curved arcs whose thickness is proportional to relationship value. Arcs should inherit their source node's color for visual coherence. Add animated moving dots that continuously travel along each arc in infinite loops. Use the Animated theme. The chart should adapt to viewport width. Use amCharts 5 library.
Demo source