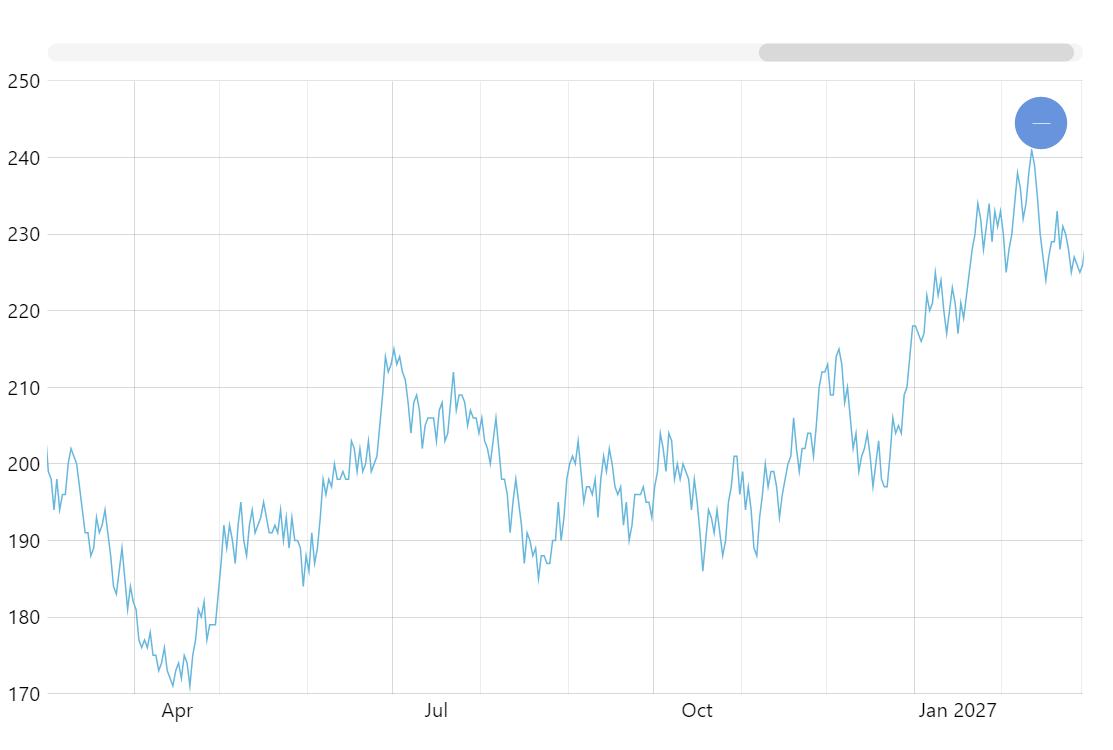
Line Graph
Line graph (also known as Line chart) displays series of data points connected by straight line segments. Line graphs are often used to display time series chronologically with category axis (usually horizontal x-axis) serving as an evenly spaced date-time scale.
Related tutorials
Build this chart with AI
The prompt below can be used to build this chart with AI. For best coding results, use the most advanced AI models, like Claude Opus 4.6 and GPT-5.3-Codex. For more info and tips, check out amCharts AI docs.
Create a line chart displaying ~1,200 daily data points on a date axis with minor grid lines. Enable panning, mouse-wheel zoom on the X-axis, and pinch-to-zoom. Add an XY cursor with tooltips showing the Y value and a horizontal scrollbar for dataset navigation. Animate on load. Use amCharts 5 library.
Demo source