Live Stock Data
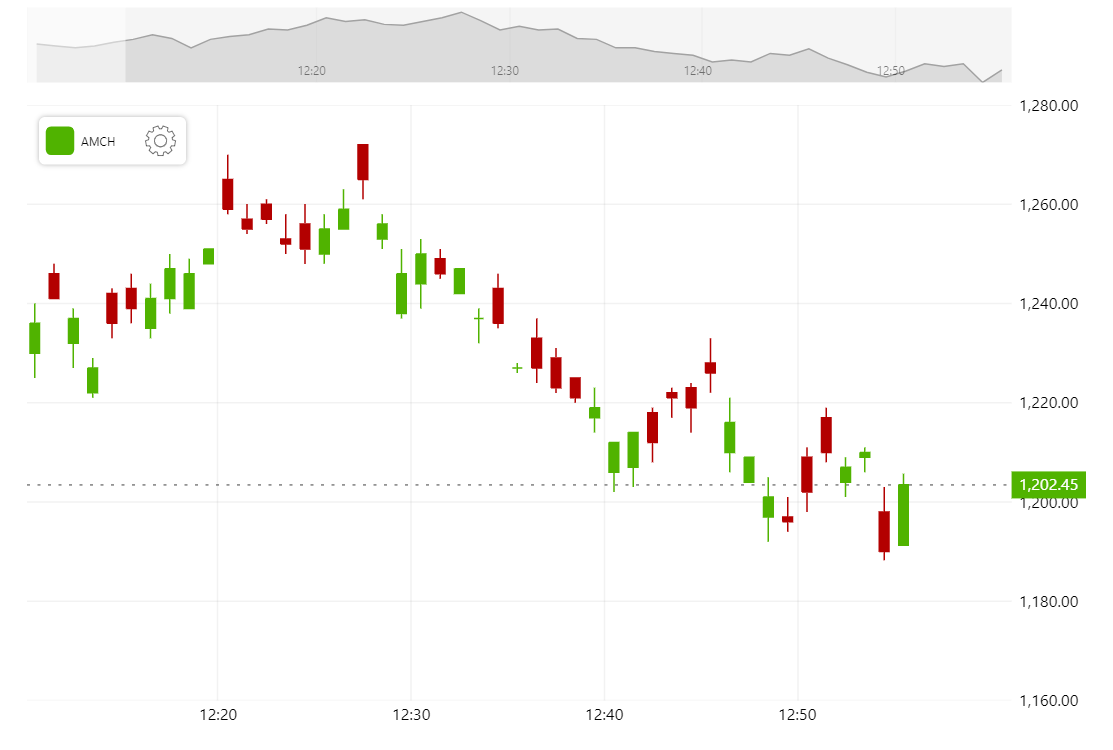
Stock Chart can display static data from a historical dataset. It can display live constantly updated data just as well. This demo shows how to setup a cursor to follow the latest data, update the dataset in real time, animate the data label to its new location and adjust the color based on the value.
Related tutorials
Build this chart with AI
The prompt below can be used to build this chart with AI. For best coding results, use the most advanced AI models, like Claude Opus 4.6 and GPT-5.3-Codex. For more info and tips, check out amCharts AI docs.
Create a live-updating stock chart that simulates real-time market data. Start with 50 minutes of historical candlestick data and update every second: when a new minute starts, add a new candle; otherwise, update the current candle's high, low, and close values with randomly fluctuating prices. Use a gapless date axis with minute-based intervals. Add a dynamic value label on the Y-axis that animates to track the current price, with its background color changing to green when the price is above the open and red when below. Include a reference line at the current price level. Add a crosshair cursor, a scrollbar with a line preview, a stock legend showing OHLC values, and mouse-wheel zoom. Apply smooth animations. Use amCharts 5 library.
Demo source