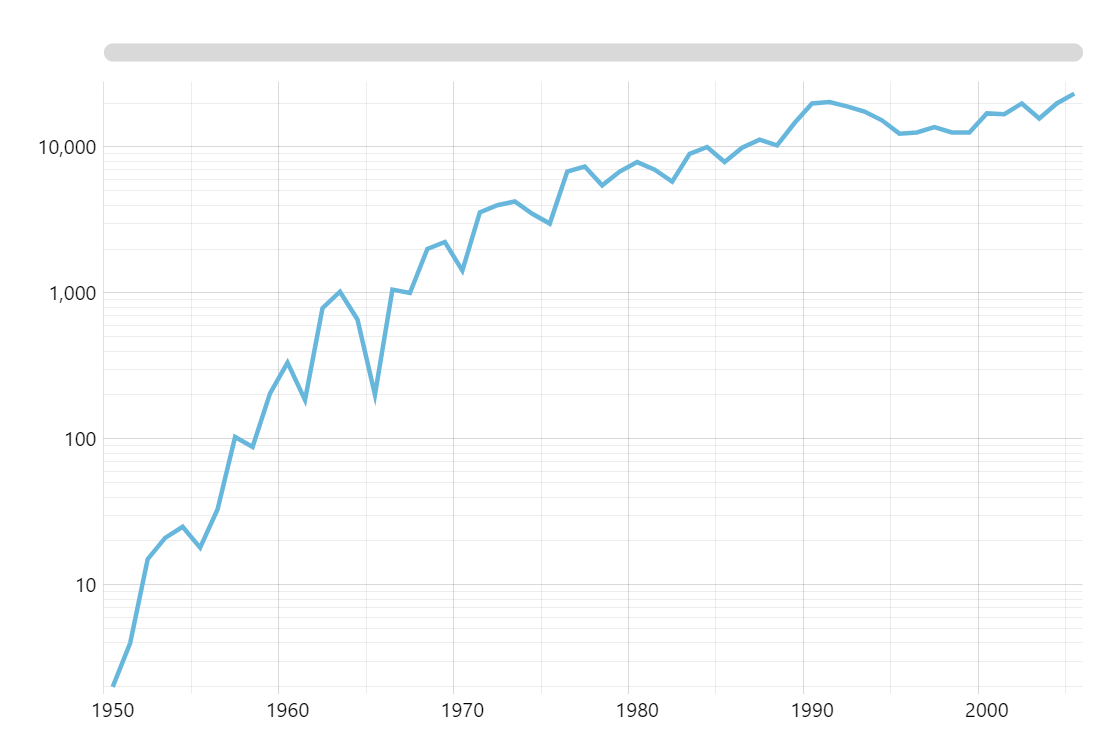
Logarithmic Scale
Displaying wide-ranging values on a regular (linear) scale makes charts unreadable. Switch your value axis to logarithmic scale and get back to highly useful data visualizations.
Key implementation details
All it takes is setting logarithmic: true on your ValueAxis.
Related tutorials
Build this chart with AI
The prompt below can be used to build this chart with AI. For best coding results, use the most advanced AI models, like Claude Opus 4.6 and GPT-5.3-Codex. For more info and tips, check out amCharts AI docs.
Create a line chart displaying data from 1950-2005 spanning a wide value range. Set the Y-axis to logarithmic scale so both small and large values are visible. Enable minor grid lines on both axes, pan/zoom on both axes, XY cursor with horizontal line only, tooltips, horizontal scrollbar, and entrance animation. Use amCharts 5 library.
Demo source