Multiple Date Axes
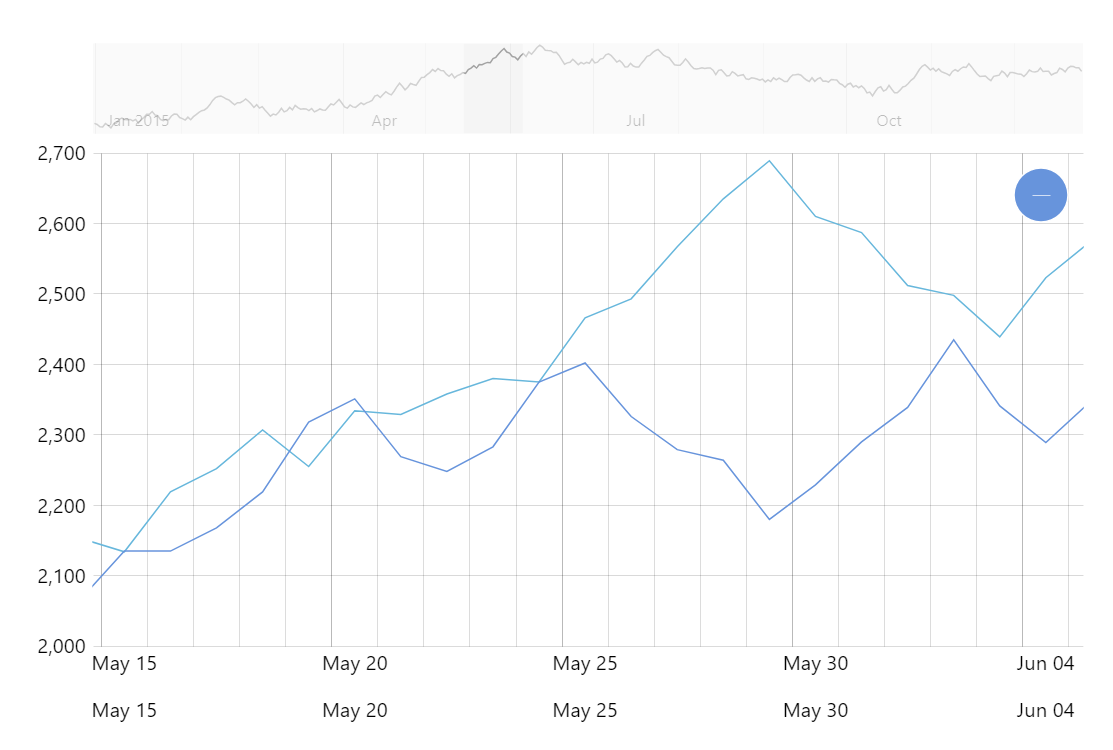
Just like you can have multiple value axes to address different ranges of values, you can also have multiple date axes in one XY chart. This could be useful when comparing data between current and previous periods, for example.
Key implementation details
Using multiple date axes is as straightforward as just adding two date axes to your chart’s xAxes in this (horizontal) scenario and then setting xAxis to the corresponding axis on each series.
Related tutorials
Build this chart with AI
The prompt below can be used to build this chart with AI. For best coding results, use the most advanced AI models, like Claude Opus 4.6 and GPT-5.3-Codex. For more info and tips, check out amCharts AI docs.
Create a line chart with two independent horizontal date axes. The first maps to 360 data points from Jan 2015, the second (below the first) maps to 360 data points from Jan 2017. Both series share one value axis. Include an XY cursor, horizontal scrollbar, tooltips with formatted dates, mouse-wheel horizontal panning, and staggered entrance animation. Use amCharts 5 library.
Demo source