Map with Animated Bubbles
Animating bullet sizes and values is a great way to showcase data changes over time. This demo shows you how to do it on a map.
Key implementation details
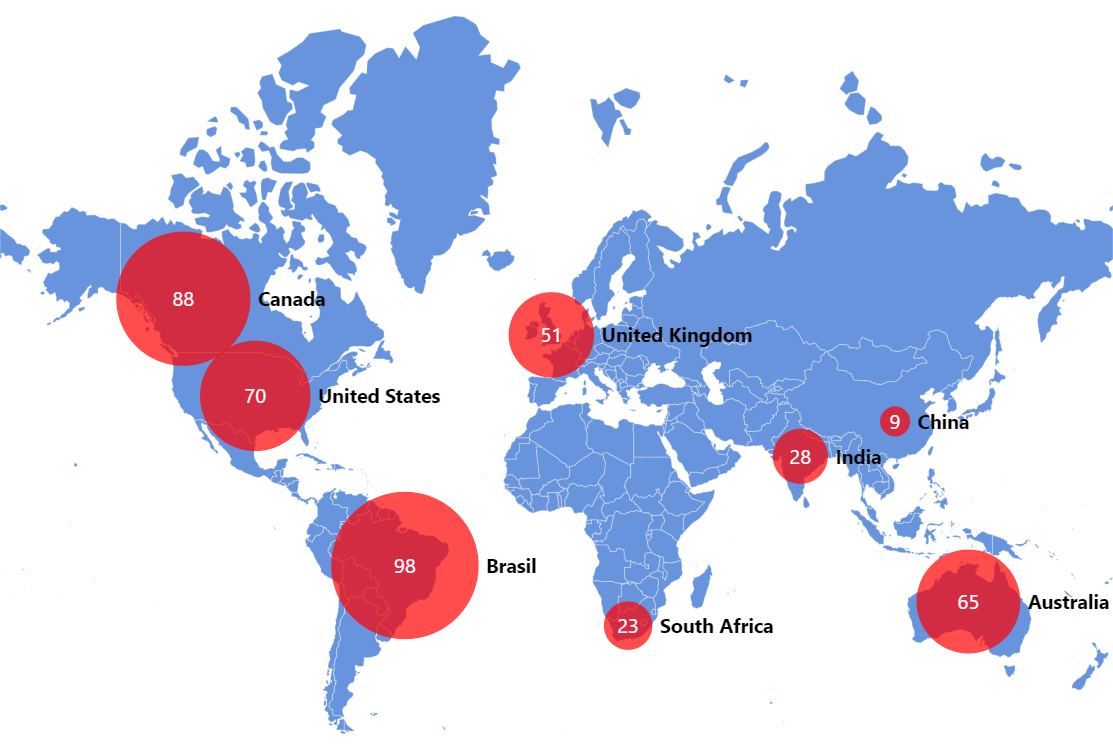
We use MapPointSeries to place the bubbles on the map. polygonIdField is set to the ID of the country polygon and the chart places the point in the center of that polygon/country. We then add a Circle as a bullet for the series. Finally, we use “heat rules” to apply settings based on the data values.
Then we just change the underlying values on a timer.
Related tutorials
Build this chart with AI
The prompt below can be used to build this chart with AI. For best coding results, use the most advanced AI models, like Claude Opus 4.6 and GPT-5.3-Codex. For more info and tips, check out amCharts AI docs.
Create a world map with animated bubble markers positioned at the center of each country. Place red circles on 8 countries (US, GB, CN, IN, AU, CA, BR, ZA) with numeric values in the 0-100 range. Scale bubble size based on data values, from small to large. Display white bold text values inside each bubble and country name labels adjacent to them. Add tooltips showing country name and value. Every 2 seconds, update the values with random numbers to demonstrate real-time animation. Change cursor to pointer on hover. Use amCharts 5 library.
Demo source