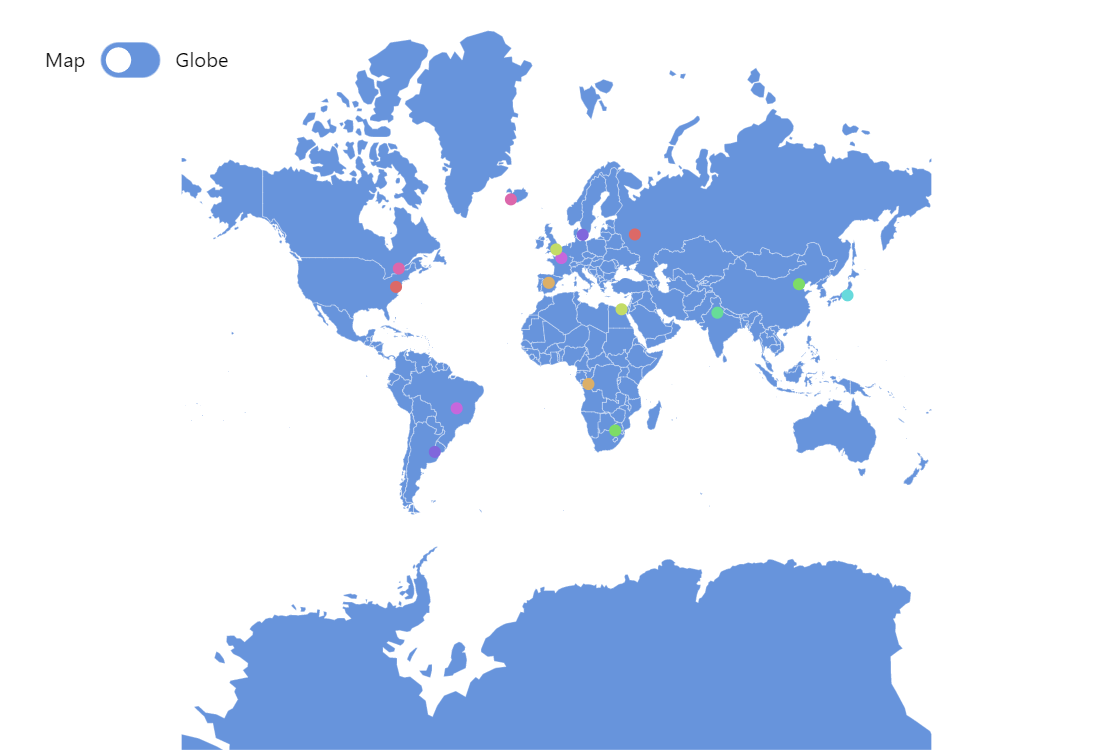
Map with Pulsating Bullets
This demo shows how to add animated dots to your maps. This could be useful to attract viewer’s attention to specific locations on the map.
Key implementation details
Our pulsating points are just bullets on MapPointSeries points. We create two circles as visuals for each data point bullet and then animate scale and opacity on one of the circles.
Related tutorials
Build this chart with AI
The prompt below can be used to build this chart with AI. For best coding results, use the most advanced AI models, like Claude Opus 4.6 and GPT-5.3-Codex. For more info and tips, check out amCharts AI docs.
Create a world map displaying 18 major capital cities as pulsating bullet markers. Each marker should consist of two concentric circles that continuously animate by growing and fading out in repeating cycles to create a pulsing radar-like effect. Assign each marker a distinct color. Include a toggle button to switch between a flat map and a 3D globe projection. Show city name tooltips on hover. Make markers clickable. Support pan and zoom capabilities that adjust based on projection mode. Animate the chart into view on load. Data points should include title, latitude, longitude, and URL properties. Use amCharts 5 library.
Demo source