Multi-Part Gauge
You can use amCharts Gauge Chart to display multiple discreet values in one gauge. One way to do that is using multiple axes overlapping in a common space. The other is to have the parts occupy separate sections of the gauge.
Key implementation details
To create the axes for each quarter of the circle we create them using AxisRendererCircular renderer with startAngle and endAngle set to the specific section angles. Then we just create clock hands associated with each of the axes.
Related tutorials
Build this chart with AI
The prompt below can be used to build this chart with AI. For best coding results, use the most advanced AI models, like Claude Opus 4.6 and GPT-5.3-Codex. For more info and tips, check out amCharts AI docs.
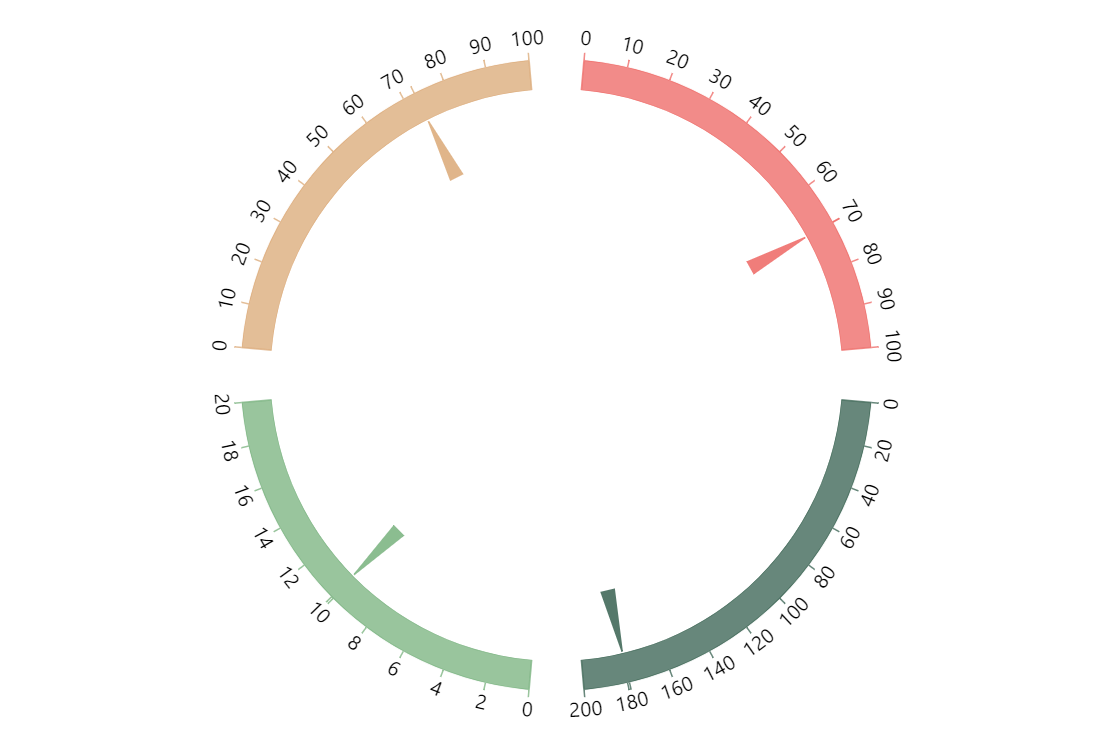
Create a multi-part gauge chart with four independent gauge sections arranged in quadrants around a circle. Each section has a custom arc spanning a different portion of the circle: upper-left (red/coral, 0-100), upper-right (dark green, 0-200), lower-right (light green, 0-20), and lower-left (tan/beige, 0-100). Each section has its own colored arc fill, matching tick marks, value axis, and a needle. Auto-update all four needles simultaneously every 2 seconds with random values within their respective ranges, with smooth animation. Use amCharts 5 library.
Demo source