Pie Chart
Pie charts are the most commonly used chart type to represent qualitative data (values in relation to the whole). amCharts has an extensive support for various pie chart sub-types and configuration options. This demo shows the most basic and commonly used implementation of pie chart.
Key implementation details
We create an instance of PieChart and add PieSeries to it with data fields configured. And that’s all you need to do to add this type of pie chart in your web app.
Related tutorials
Build this chart with AI
The prompt below can be used to build this chart with AI. For best coding results, use the most advanced AI models, like Claude Opus 4.6 and GPT-5.3-Codex. For more info and tips, check out amCharts AI docs.
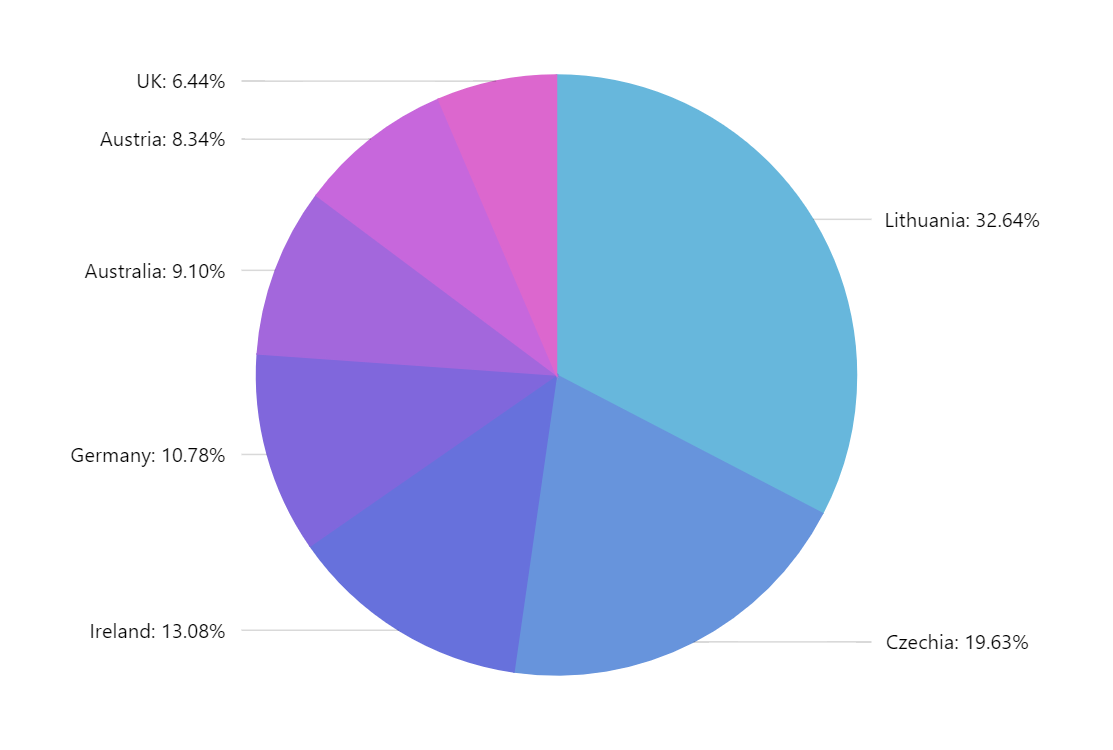
Create a pie chart that displays categorical data for seven countries (Lithuania, Czechia, Ireland, Germany, Australia, Austria, UK) with corresponding numeric values. The pie should render as a three-quarter circle. Each slice should be proportionally sized based on its value. Include an animated entrance where slices appear sequentially one after another. Display tooltips on hover showing category name and value. The chart should be responsive, filling 100% width at 500px height. Use amCharts 5 library.
Demo source