Polar Area Chart
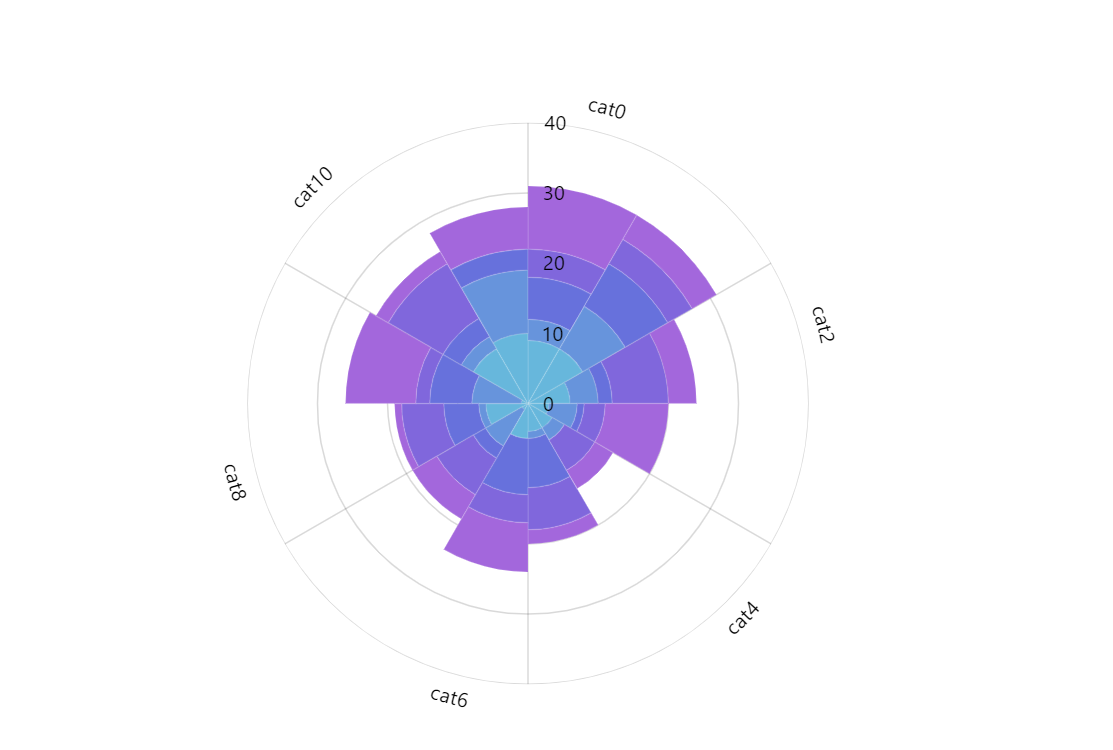
Polar area chart (also known as Polar area diagram, Coxcomb chart, Rose chart) is often used to plot cyclical data like average monthly temperature, hourly traffic to a website, etc.
One of the most famous early uses of polar area chart is “Diagram of the causes of mortality in the army in the East” by Florence Nightingale.
Related tutorials
Build this chart with AI
The prompt below can be used to build this chart with AI. For best coding results, use the most advanced AI models, like Claude Opus 4.6 and GPT-5.3-Codex. For more info and tips, check out amCharts AI docs.
Create a polar area chart (also known as a Coxcomb or Rose chart) using a radar layout with 5 stacked column series and 12 categories arranged in a full circle. Generate random values between 0-10 for each category/series combination. Configure columns to span full width with subtle borders. Use a circular category axis with outward labels and a radial value axis rendered as concentric circles. Add a cursor with zoom behavior and both horizontal and vertical scrollbars. Show tooltips with series name and value. Animate series sequentially on load. Apply an animated theme. Use amCharts 5 library.
Demo source