Rotating Globe with Circles
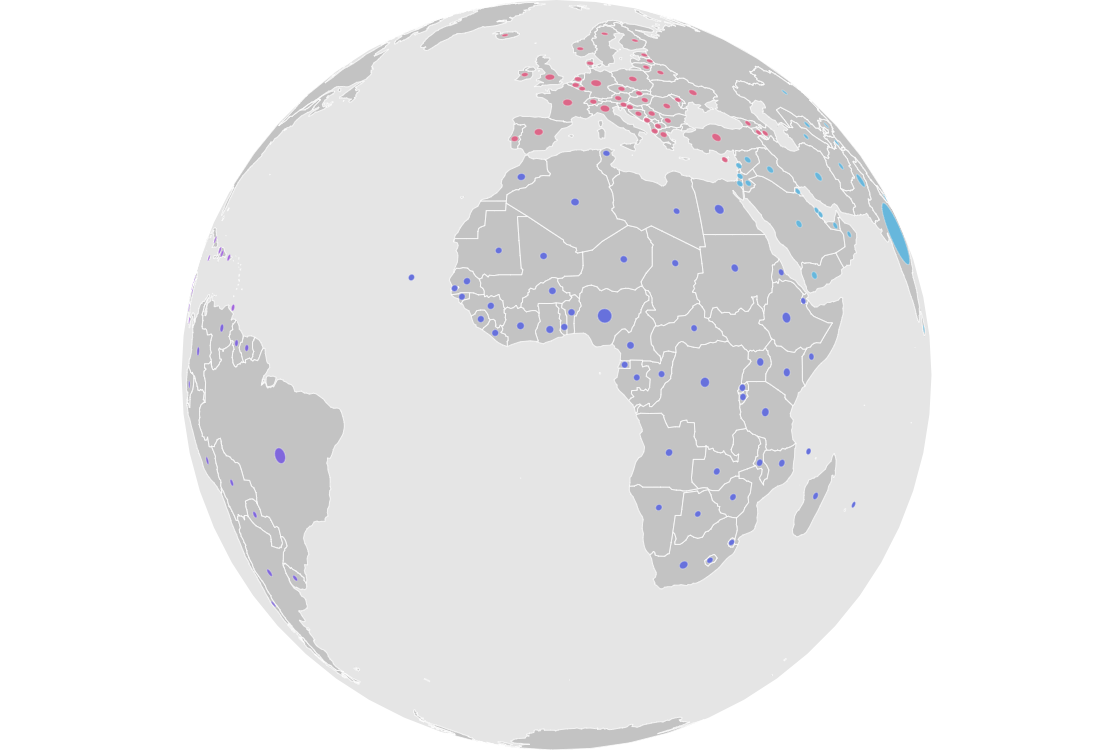
With amCharts 5 you can create amazing Map charts and you don’t have to be limited to flattened representation of Earth. As you can see in this demo, you can use an orthographic projection to display the planet as an interactive globe.
Learn more about map projections in our documentation.
Build this chart with AI
The prompt below can be used to build this chart with AI. For best coding results, use the most advanced AI models, like Claude Opus 4.6 and GPT-5.3-Codex. For more info and tips, check out amCharts AI docs.
Create an interactive 3D globe that displays population data for 195+ countries. Overlay proportional circles on each country's center, with circle size scaling based on population values. Color-code countries by continent using different colors for Asia, Africa, South America, North America/Caribbean, and Europe. Render a semi-transparent world polygon layer as geographic context behind the circles. Show tooltips with country name and population value. Support free globe rotation by dragging. Include a smooth loading animation. Make the layout responsive for tablet screens. Use amCharts 5 library.
Demo source