Sankey Map With Waypoints
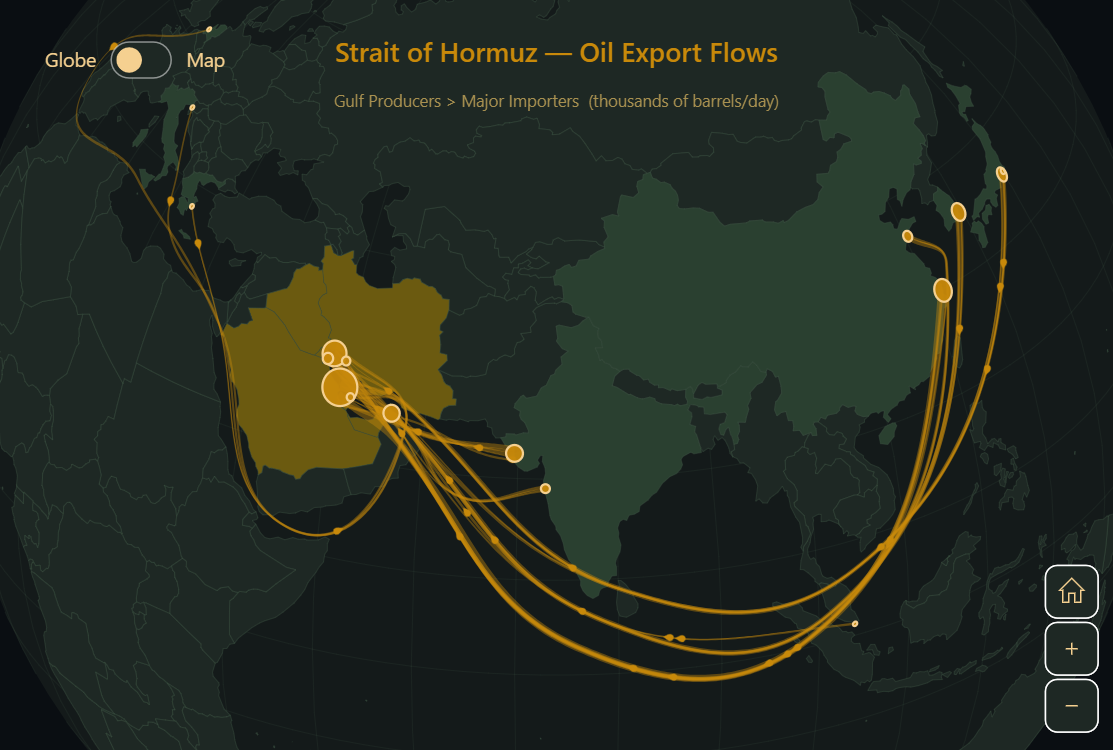
MapSankeySeries draws Sankey-style flow bands directly on a map chart. This demo maps crude oil exports from Gulf terminals through the Strait of Hormuz to refineries in Asia and Europe, with animated oil-drop bullets traveling along each route.
Key implementation details
Each data item uses explicit sourceLongitude/sourceLatitude and targetLongitude/targetLatitude coordinates so that flows start at actual port locations rather than country centroids. A waypoints array steers each route through intermediate coordinates — the Strait of Hormuz exit, the Arabian Sea, the Malacca Strait, and the Suez Canal — keeping flows on realistic shipping lanes instead of cutting through land.
Bullet animation durations are scaled proportionally using sankeySeries.getPathLength(dataItem), so short routes animate faster than long ones.
For a simpler example that uses country-based sourceId/targetId instead of explicit coordinates, see the Coffee Supply Chain demo.
Related tutorials
Build this chart with AI
The prompt below can be used to build this chart with AI. For best coding results, use the most advanced AI models, like Claude Opus 4.6 and GPT-5.3-Codex. For more info and tips, check out amCharts AI docs.
Create a map chart showing crude oil export flows from Gulf producer countries to major importers in Asia and Europe. Use a globe projection with MapSankeySeries for proportional flow bands. Routes should follow sea lanes, not cut through land. Include animated bullets traveling along routes and tooltips showing volume data. Use amCharts 5 library.
Demo source