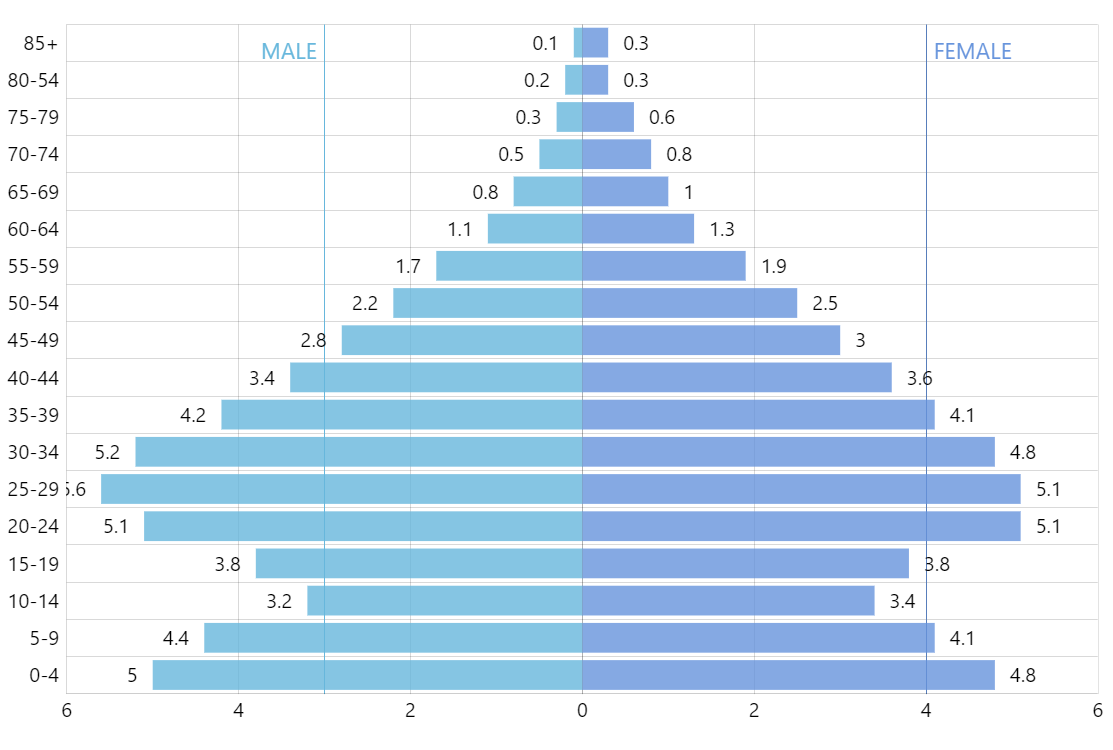
Stacked Bar Chart with Negative Values
In this demo we use negative numbers to create a population pyramid via a stacked bar chart with bars appearing on both sides of the axis. We then tell the chart to display absolute values so our “trick” isn’t visible to the viewer.
Key implementation details
We use negative numbers for the “male” series but set chart to display absolute numbers only via chart.getNumberFormatter().set("numberFormat", "#.#s"). Then we make sure our columns are placed on top of each other (though they don’t overlap due to values being on opposites sides of 0) by setting clustered: false on the series.
Related tutorials
Demo source