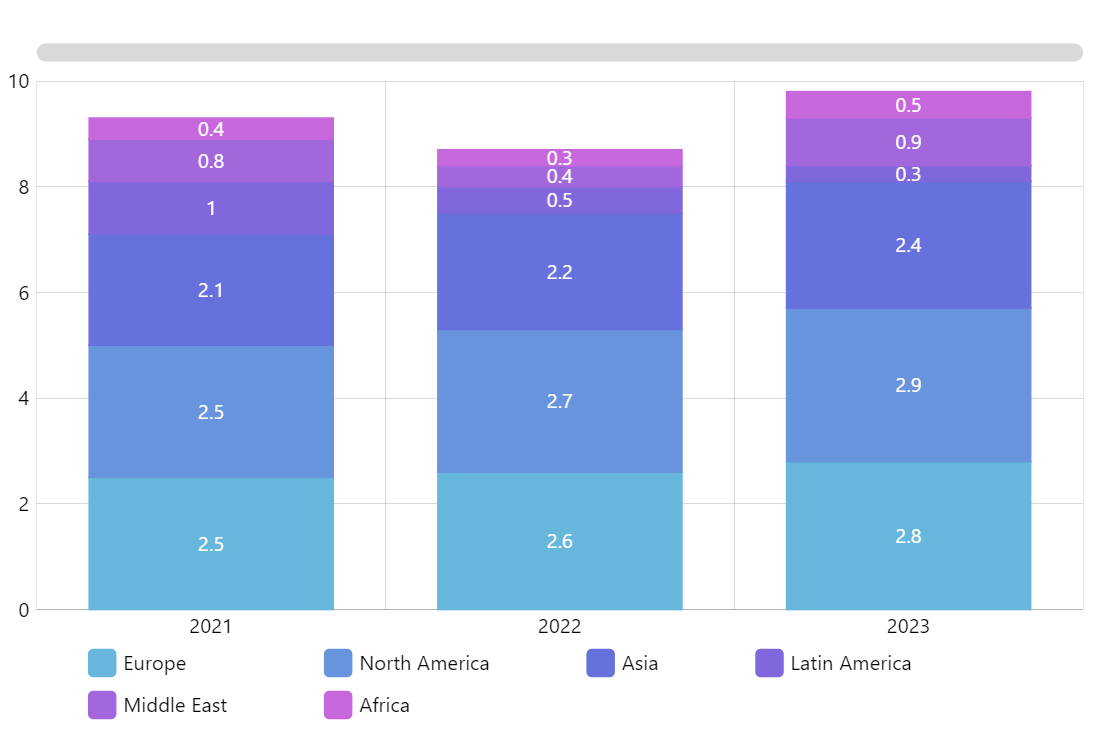
Stacked Column Chart
Stacked bar charts are useful to demonstrate how a larger data category is comprised of smaller categories, and what part each of the smaller categories plays in the total of a larger one.
Key implementation details
The key here is to set stacked property on series to true.
Related tutorials
Demo source