Step Line Without Risers
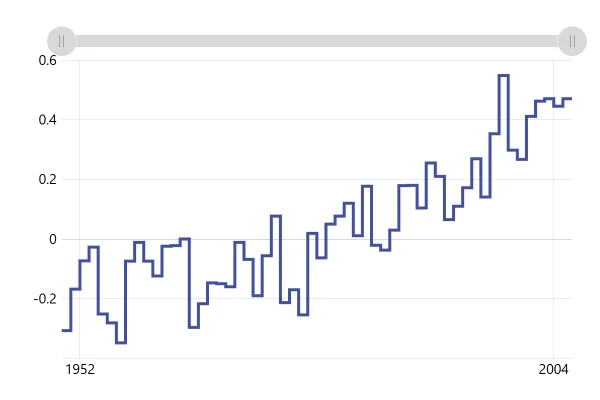
A step chart with only the flat parts: each day is a short level line over a light fill, with nothing joining one day to the next.
About this chart
When to drop the risers
Without risers, each value stands alone as the level for its period, so the eye compares heights instead of following jumps. It suits values that belong to a slot, like a day’s quota or a month’s rate, where each level matters more than the change between them.
Good for
- Values that apply to a whole day, week or month
- Rates or prices per period, like tariffs
- Busy step lines where the vertical lines get in the way
Think twice when
- Showing how far a value jumped: keep the risers
- Hundreds of points: the dashes shrink to dots
- Exact comparisons between periods: columns are easier to read
For developers
Get the code.
Built with amCharts 5, a JavaScript library. The JavaScript includes your theme and renderer (canvas or SVG); the JSON also follows the changes you make with the controls.
For projects that use npm:
How it reads:
npm install @amcharts/amcharts5. See Getting started.
The same chart as a JSON config. Chart Maker reads and writes this format, the library's JSON parser turns it into a chart, and the <am5-chart> element puts it on a page with no code.How it reads:
"type" is the class to create and "settings" what you would pass to its new() in code; "properties" fill in its parts, lists such as series and axes or templates such as columns.template; "refs" holds objects used in more than one place ("#series-0" stands for the one named series-0); a string starting with "@" takes a value from another object, such as "@series.get('fill')".
A complete page. Save it as an .html file and open it in a browser.
Paste this into an AI coding assistant to build the chart from scratch. More in amCharts & AI.
// Create root element
// https://docs.amcharts.com/v5/getting-started/#root-element
var root = am5.Root.new("chartdiv");

// Set themes
// https://docs.amcharts.com/v5/concepts/themes/
root.setThemes([
  am5themes_Animated.new(root),
  am5themes_Responsive.new(root)
]);

// Create chart
// https://docs.amcharts.com/v5/charts/xy-chart/
var chart = root.container.children.push(am5xy.XYChart.new(root, {
  // a drag zooms (the cursor's behavior), so the chart itself doesn't pan
  panX: false,
  panY: false,
  wheelX: "panX",   // a horizontal wheel or trackpad swipe pans...
  wheelY: "zoomX",  // ...and the vertical wheel zooms in on the dates
  pinchZoomX: true, // pinch to zoom the dates on a touch screen
  paddingLeft: 0    // no gap at the chart's left edge
}));

// Add cursor
// https://docs.amcharts.com/v5/charts/xy-chart/cursor/
var cursor = chart.set("cursor", am5xy.XYCursor.new(root, {
  // drag across the plot to zoom in on those days
  behavior: "zoomX"
}));
cursor.lineY.set("visible", false); // no horizontal cursor line, only the vertical one

// Generate random data
var date = new Date();
date.setHours(0, 0, 0, 0); // start at midnight
var value = 100;           // the first value

// one day of data: the value moves up to 5 up or down from the day before
function generateData() {
  value = Math.round((Math.random() * 10 - 5) + value);

  if (value < 10) {
    value = 10; // but never below 10
  }

  am5.time.add(date, "day", 1); // the next day
  return { date: date.getTime(), value: value };
}

// a list of count days of data
function generateDatas(count) {
  var data = [];
  for (var i = 0; i < count; ++i) {
    data.push(generateData());
  }
  return data;
}

// Create axes
// https://docs.amcharts.com/v5/charts/xy-chart/axes/
var xAxis = chart.xAxes.push(am5xy.DateAxis.new(root, {
  baseInterval: { timeUnit: "day", count: 1 }, // one data point a day
  renderer: am5xy.AxisRendererX.new(root, {
    // dragging the axis zooms it instead of panning
    pan: "zoom",
    minorGridEnabled: true, // fainter grid lines between the labeled dates
    minGridDistance: 80     // at least 80px between the date labels
  }),
  tooltip: am5.Tooltip.new(root, {}) // shows the cursor's date on the axis
}));

var yAxis = chart.yAxes.push(am5xy.ValueAxis.new(root, {
  renderer: am5xy.AxisRendererY.new(root, {
    pan: "zoom" // drag along the axis to zoom it
  })
}));

// Hide the label at the very bottom of the value axis: it would run into
// the first date label in the corner
yAxis.get("renderer").labels.template.set("minPosition", 0.05);

// Add series
// https://docs.amcharts.com/v5/charts/xy-chart/series/
var series = chart.series.push(am5xy.StepLineSeries.new(root, {
  name: "Series",
  xAxis: xAxis,
  yAxis: yAxis,
  valueYField: "value",
  valueXField: "date",
  // only the flat steps: no vertical lines joining one to the next
  noRisers: true,
  tooltip: am5.Tooltip.new(root, {
    labelText: "{valueY}" // hover for the day's value
  })
}));

series.strokes.template.setAll({
  strokeWidth: 3 // a 3px line
});

series.fills.template.setAll({
  fillOpacity: 0.1, // a faint fill under the steps...
  visible: true     // ...turned on: line series have none by default
});

// Add scrollbar
// https://docs.amcharts.com/v5/charts/xy-chart/scrollbars/
chart.set("scrollbarX", am5.Scrollbar.new(root, {
  orientation: "horizontal" // above the plot; zooms the dates
}));

var data = generateDatas(50); // 50 days
series.data.setAll(data);

// Make stuff animate on load
// https://docs.amcharts.com/v5/concepts/animations/
series.appear(1000);
chart.appear(1000, 100);
{
"type": "XYChart",
"settings": {
"panX": false,
"panY": false,
"wheelX": "panX",
"wheelY": "zoomX",
"pinchZoomX": true,
"paddingLeft": 0,
"cursor": {
"type": "XYCursor",
"settings": {
"behavior": "zoomX"
},
"properties": {
"lineY": {
"settings": {
"visible": false
}
}
}
},
"scrollbarX": {
"type": "Scrollbar",
"settings": {
"orientation": "horizontal"
}
}
},
"properties": {
"series": [
"#series-0"
],
"xAxes": [
"#axis-0"
],
"yAxes": [
"#axis-1"
]
},
"refs": [
{
"data-0": [
{
"date": 1791406800000,
"value": 100
},
{
"date": 1791493200000,
"value": 98
},
{
"date": 1791579600000,
"value": 97
},
{
"date": 1791666000000,
"value": 94
},
{
"date": 1791752400000,
"value": 96
},
{
"date": 1791838800000,
"value": 91
},
{
"date": 1791925200000,
"value": 90
},
{
"date": 1792011600000,
"value": 92
},
{
"date": 1792098000000,
"value": 92
},
{
"date": 1792184400000,
"value": 87
},
{
"date": 1792270800000,
"value": 84
},
{
"date": 1792357200000,
"value": 87
},
{
"date": 1792443600000,
"value": 92
},
{
"date": 1792530000000,
"value": 88
},
{
"date": 1792616400000,
"value": 87
},
{
"date": 1792702800000,
"value": 92
},
{
"date": 1792789200000,
"value": 95
},
{
"date": 1792875600000,
"value": 93
},
{
"date": 1792965600000,
"value": 96
},
{
"date": 1793052000000,
"value": 92
},
{
"date": 1793138400000,
"value": 95
},
{
"date": 1793224800000,
"value": 98
},
{
"date": 1793311200000,
"value": 99
},
{
"date": 1793397600000,
"value": 97
},
{
"date": 1793484000000,
"value": 101
},
{
"date": 1793570400000,
"value": 102
},
{
"date": 1793656800000,
"value": 105
},
{
"date": 1793743200000,
"value": 100
},
{
"date": 1793829600000,
"value": 100
},
{
"date": 1793916000000,
"value": 96
},
{
"date": 1794002400000,
"value": 100
},
{
"date": 1794088800000,
"value": 104
},
{
"date": 1794175200000,
"value": 99
},
{
"date": 1794261600000,
"value": 102
},
{
"date": 1794348000000,
"value": 107
},
{
"date": 1794434400000,
"value": 105
},
{
"date": 1794520800000,
"value": 102
},
{
"date": 1794607200000,
"value": 98
},
{
"date": 1794693600000,
"value": 102
},
{
"date": 1794780000000,
"value": 105
},
{
"date": 1794866400000,
"value": 102
},
{
"date": 1794952800000,
"value": 97
},
{
"date": 1795039200000,
"value": 95
},
{
"date": 1795125600000,
"value": 93
},
{
"date": 1795212000000,
"value": 91
},
{
"date": 1795298400000,
"value": 93
},
{
"date": 1795384800000,
"value": 90
},
{
"date": 1795471200000,
"value": 94
},
{
"date": 1795557600000,
"value": 93
},
{
"date": 1795644000000,
"value": 94
}
]
},
{
"axis-0": {
"type": "DateAxis",
"settings": {
"baseInterval": {
"timeUnit": "day",
"count": 1
},
"renderer": {
"type": "AxisRendererX",
"settings": {
"pan": "zoom",
"minorGridEnabled": true,
"minGridDistance": 80
}
},
"tooltip": {
"type": "Tooltip"
}
}
}
},
{
"axis-1": {
"type": "ValueAxis",
"settings": {
"renderer": {
"type": "AxisRendererY",
"settings": {
"pan": "zoom"
},
"properties": {
"labels": {
"properties": {
"template": {
"settings": {
"minPosition": 0.05
}
}
}
}
}
}
}
}
},
{
"series-0": {
"type": "StepLineSeries",
"settings": {
"name": "Series",
"xAxis": "#axis-0",
"yAxis": "#axis-1",
"valueYField": "value",
"valueXField": "date",
"noRisers": true,
"tooltip": {
"type": "Tooltip",
"settings": {
"labelText": "{valueY}"
}
}
},
"properties": {
"data": "#data-0",
"strokes": {
"properties": {
"template": {
"settings": {
"strokeWidth": 3
}
}
}
},
"fills": {
"properties": {
"template": {
"settings": {
"fillOpacity": 0.1,
"visible": true
}
}
}
}
}
}
}
]
}