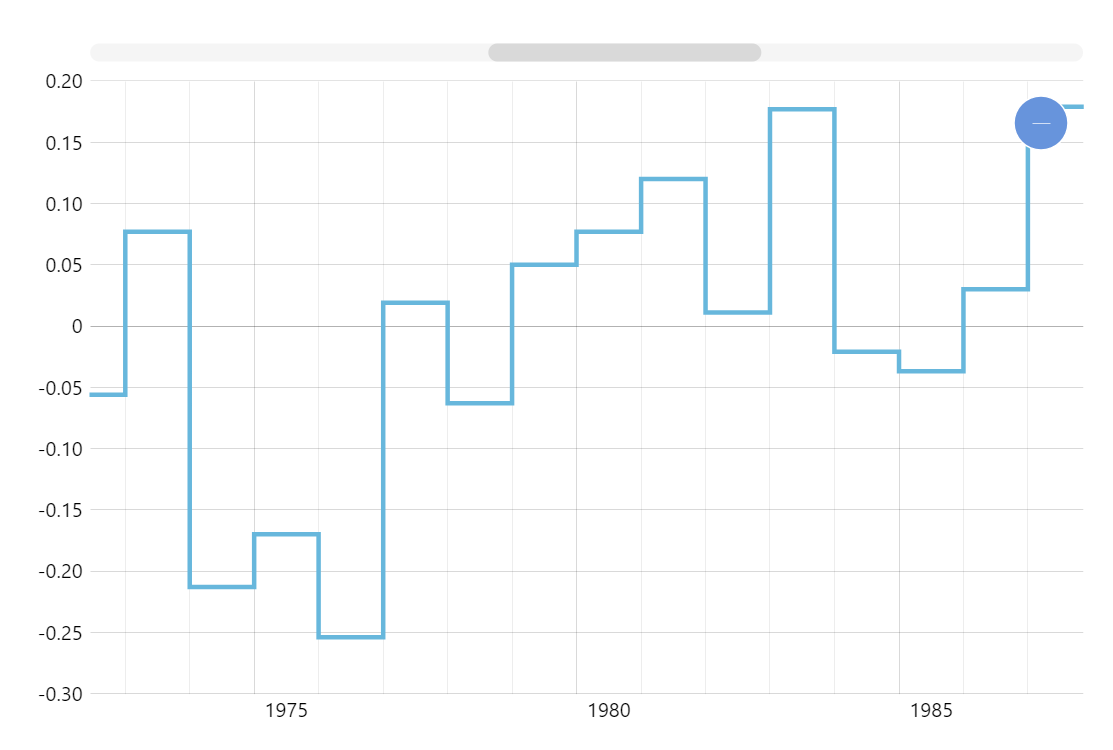
Step Line Chart
Step Line Chart (also known as Step Chart, Stepped Line Chart) is useful when you want to show changes happening at specific points. In contrast to Line Chart, which connects data points with the shortest possible line thus creating an appearance of values changing gradually, Step Line Chart highlights that values change discretely at specific points.
Related tutorials
Build this chart with AI
The prompt below can be used to build this chart with AI. For best coding results, use the most advanced AI models, like Claude Opus 4.6 and GPT-5.3-Codex. For more info and tips, check out amCharts AI docs.
Create a step line chart displaying temperature anomaly data from 1950-2005 with 56 annual data points showing discrete year-to-year jumps. Use a date axis with yearly intervals and minor grid lines. Include tooltips with year and value, XY cursor, horizontal scrollbar, pan and mouse-wheel zoom, and entrance animation. Use amCharts 5 library.
Demo source