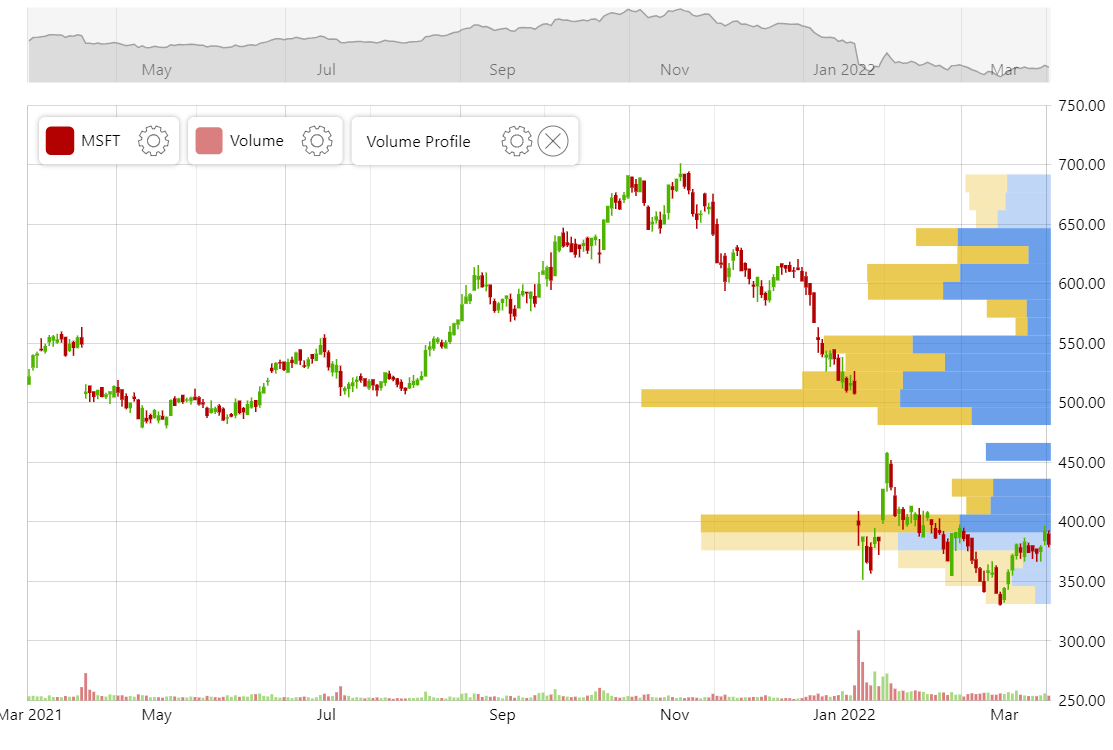
Stock Chart with Volume Profile
The Volume Profile indicator (or Volume-by-price) displays the distribution of trading volume at different price levels, offering insights into key support and resistance areas. By illustrating areas of high or low trading activity, it helps traders identify potential price levels of significance and make informed decisions.
Volume Profile indicator comes bundled with amCharts 5: Stock Chart.
For more information, read “Volume Profile Indicator” blog post.
Related tutorials
Build this chart with AI
The prompt below can be used to build this chart with AI. For best coding results, use the most advanced AI models, like Claude Opus 4.6 and GPT-5.3-Codex. For more info and tips, check out amCharts AI docs.
Create a stock chart with an upper candlestick price panel and a lower volume column panel. Display OHLC candlestick data with volume columns color-coded by price direction. Add a Volume Profile indicator that visualizes trading activity distribution across price levels as horizontal bars, highlighting areas where significant volume concentration occurs. Include a date axis, a price value axis, and a volume axis. Add a scrollbar, a crosshair cursor, and stock legends. Provide toolbar controls for indicators, date range, period selection, drawing tools, reset, and settings. Use amCharts 5 library.
Demo source