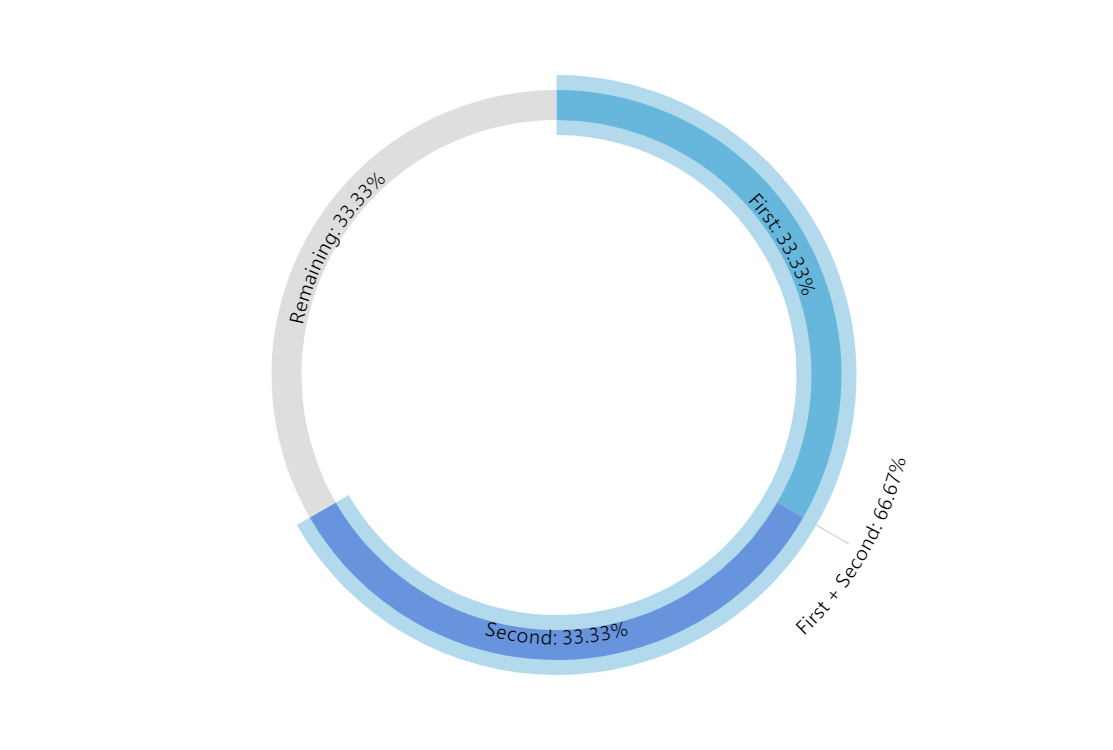
Two-Level Pie Chart
Two-Level pie chart (or a multi-level pie chart as a generic case) lets you display data in multiple dimensions. For example, you can show detailed data as one level and then that same data grouped into higher-level groups as a second level.
Key implementation details
To achieve the effect in this demo, we create two pie series and specify radius and innerRadius of one to go from 80% to 100% (for the wider slice) and the other is 85% to 95%.
Related tutorials
Build this chart with AI
The prompt below can be used to build this chart with AI. For best coding results, use the most advanced AI models, like Claude Opus 4.6 and GPT-5.3-Codex. For more info and tips, check out amCharts AI docs.
Create a two-level concentric pie chart with an outer ring showing grouped summary data and an inner ring showing detailed breakdowns. The outer series displays two segments: a combined 'First + Second' (60%) and 'Unused' (30%, hidden). The inner series shows 'First' (30%), 'Second' (30%), and 'Remaining' (30%, colored gray). The outer ring slices should be slightly transparent with no borders. Slices should scale slightly on hover. Use centered text labels within each ring. Include tick marks on the outer series. Apply a smooth animated theme. Use amCharts 5 library.
Demo source