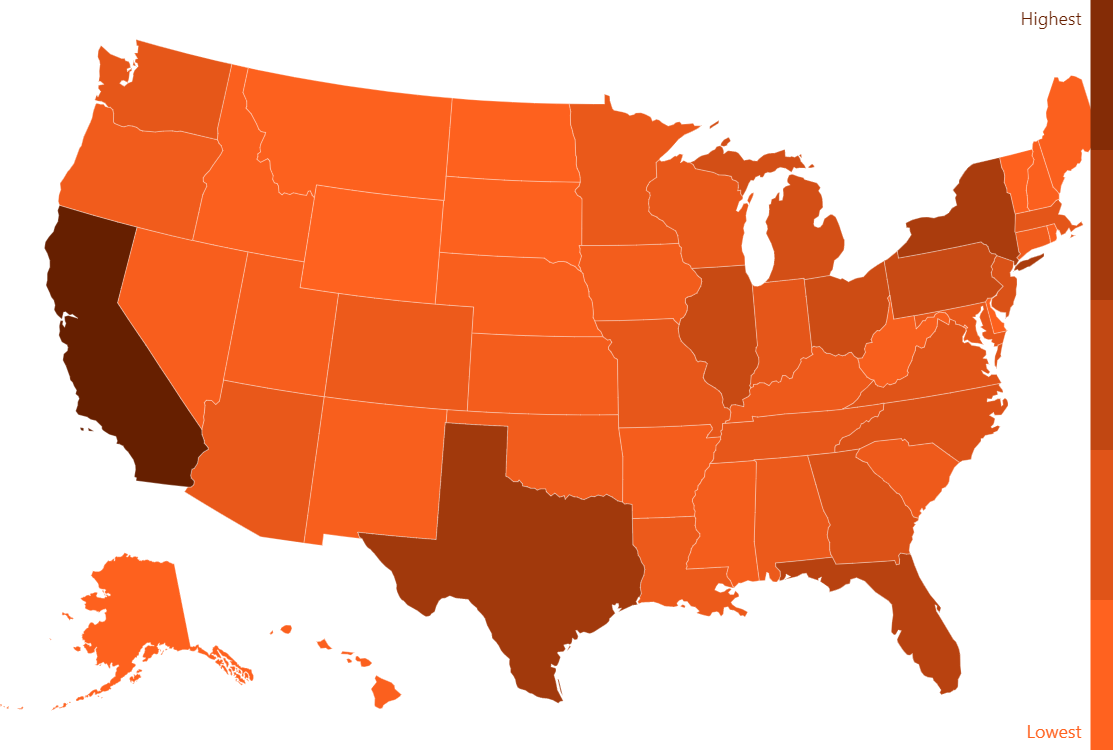
US Heat (Choropleth) Map
Using our mapping tool you can easily create heat (or as BI-centric folks like to call it, choropleth) maps. You only need to set light and dark color, and if your areas/countries/states has value assigned, the map will automatically choose intermediate color corresponding its value.
Related tutorials
Build this chart with AI
The prompt below can be used to build this chart with AI. For best coding results, use the most advanced AI models, like Claude Opus 4.6 and GPT-5.3-Codex. For more info and tips, check out amCharts AI docs.
Create a US choropleth map showing population data for all 50 states and territories. Color states using a gradient from orange for lowest values to dark brown for highest values, with intermediate colors applied proportionally. Include a vertical color legend with 'Lowest' and 'Highest' labels. Display tooltips showing state name and population value on hover. Update the legend dynamically to show specific values when hovering over states. Use the Albers USA projection. Enable horizontal panning only. Data format should be { id: 'US-[STATE-CODE]', value: [POPULATION] }. Use amCharts 5 library.
Demo source