Horizontal Dumbbell plot
A demo of amCharts 4, the previous version. See it in amCharts 5.
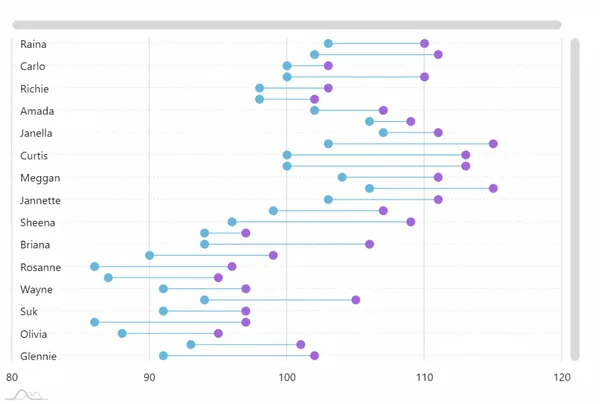
This is the amCharts 4 version. See this demo in amCharts 5
Open in:
Code
JavaScript
// Themes begin
am4core.useTheme(am4themes_animated);
// Themes end

var chart = am4core.create("chartdiv", am4charts.XYChart);

var data = [];
var open = 100;
var close = 120;

var names = ["Raina",
  "Demarcus",
  "Carlo",
  "Jacinda",
  "Richie",
  "Antony",
  "Amada",
  "Idalia",
  "Janella",
  "Marla",
  "Curtis",
  "Shellie",
  "Meggan",
  "Nathanael",
  "Jannette",
  "Tyrell",
  "Sheena",
  "Maranda",
  "Briana",
  "Rosa",
  "Rosanne",
  "Herman",
  "Wayne",
  "Shamika",
  "Suk",
  "Clair",
  "Olivia",
  "Hans",
  "Glennie",
];

for (var i = 0; i < names.length; i++) {
  open += Math.round((Math.random() < 0.5 ? 1 : -1) * Math.random() * 5);
  close = open + Math.round(Math.random() * 10) + 3;
  data.push({ category: names[i], open: open, close: close });
}

chart.data = data;

var categoryAxis = chart.yAxes.push(new am4charts.CategoryAxis());
categoryAxis.renderer.grid.template.location = 0;
categoryAxis.renderer.ticks.template.disabled = true;
categoryAxis.renderer.axisFills.template.disabled = true;
categoryAxis.dataFields.category = "category";
categoryAxis.renderer.minGridDistance = 15;
categoryAxis.renderer.inversed = true;
categoryAxis.renderer.inside = true;
categoryAxis.renderer.grid.template.location = 0.5;
categoryAxis.renderer.grid.template.strokeDasharray = "1,3";

var valueAxis = chart.xAxes.push(new am4charts.ValueAxis());
valueAxis.tooltip.disabled = true;
valueAxis.renderer.ticks.template.disabled = true;
valueAxis.renderer.axisFills.template.disabled = true;

var series = chart.series.push(new am4charts.ColumnSeries());
series.dataFields.categoryY = "category";
series.dataFields.openValueX = "open";
series.dataFields.valueX = "close";
series.tooltipText = "open: {openValueX.value} close: {valueX.value}";
series.sequencedInterpolation = true;
series.fillOpacity = 0;
series.strokeOpacity = 1;
series.columns.template.height = 0.01;
series.tooltip.pointerOrientation = "vertical";

var openBullet = series.bullets.create(am4charts.CircleBullet);
openBullet.locationX = 1;

var closeBullet = series.bullets.create(am4charts.CircleBullet);

closeBullet.fill = chart.colors.getIndex(4);
closeBullet.stroke = closeBullet.fill;

chart.cursor = new am4charts.XYCursor();
chart.cursor.behavior = "zoomY";

chart.scrollbarX = new am4core.Scrollbar();
chart.scrollbarY = new am4core.Scrollbar();
HTML
<div id="chartdiv"></div>CSS
#chartdiv {
  width: 100%;
  height: 700px;
}
Resources
https://cdn.amcharts.com/lib/4/core.js
https://cdn.amcharts.com/lib/4/charts.js
https://cdn.amcharts.com/lib/4/themes/animated.js
All in one page
<!-- Resources -->
<script src="https://cdn.amcharts.com/lib/4/core.js"></script>
<script src="https://cdn.amcharts.com/lib/4/charts.js"></script>
<script src="https://cdn.amcharts.com/lib/4/themes/animated.js"></script>

<!-- Chart code -->
<script>
// Themes begin
am4core.useTheme(am4themes_animated);
// Themes end

var chart = am4core.create("chartdiv", am4charts.XYChart);

var data = [];
var open = 100;
var close = 120;

var names = ["Raina",
  "Demarcus",
  "Carlo",
  "Jacinda",
  "Richie",
  "Antony",
  "Amada",
  "Idalia",
  "Janella",
  "Marla",
  "Curtis",
  "Shellie",
  "Meggan",
  "Nathanael",
  "Jannette",
  "Tyrell",
  "Sheena",
  "Maranda",
  "Briana",
  "Rosa",
  "Rosanne",
  "Herman",
  "Wayne",
  "Shamika",
  "Suk",
  "Clair",
  "Olivia",
  "Hans",
  "Glennie",
];

for (var i = 0; i < names.length; i++) {
  open += Math.round((Math.random() < 0.5 ? 1 : -1) * Math.random() * 5);
  close = open + Math.round(Math.random() * 10) + 3;
  data.push({ category: names[i], open: open, close: close });
}

chart.data = data;

var categoryAxis = chart.yAxes.push(new am4charts.CategoryAxis());
categoryAxis.renderer.grid.template.location = 0;
categoryAxis.renderer.ticks.template.disabled = true;
categoryAxis.renderer.axisFills.template.disabled = true;
categoryAxis.dataFields.category = "category";
categoryAxis.renderer.minGridDistance = 15;
categoryAxis.renderer.inversed = true;
categoryAxis.renderer.inside = true;
categoryAxis.renderer.grid.template.location = 0.5;
categoryAxis.renderer.grid.template.strokeDasharray = "1,3";

var valueAxis = chart.xAxes.push(new am4charts.ValueAxis());
valueAxis.tooltip.disabled = true;
valueAxis.renderer.ticks.template.disabled = true;
valueAxis.renderer.axisFills.template.disabled = true;

var series = chart.series.push(new am4charts.ColumnSeries());
series.dataFields.categoryY = "category";
series.dataFields.openValueX = "open";
series.dataFields.valueX = "close";
series.tooltipText = "open: {openValueX.value} close: {valueX.value}";
series.sequencedInterpolation = true;
series.fillOpacity = 0;
series.strokeOpacity = 1;
series.columns.template.height = 0.01;
series.tooltip.pointerOrientation = "vertical";

var openBullet = series.bullets.create(am4charts.CircleBullet);
openBullet.locationX = 1;

var closeBullet = series.bullets.create(am4charts.CircleBullet);

closeBullet.fill = chart.colors.getIndex(4);
closeBullet.stroke = closeBullet.fill;

chart.cursor = new am4charts.XYCursor();
chart.cursor.behavior = "zoomY";

chart.scrollbarX = new am4core.Scrollbar();
chart.scrollbarY = new am4core.Scrollbar();
</script>

<!-- HTML -->
<div id="chartdiv"></div>