Variable-radius Nested Pie
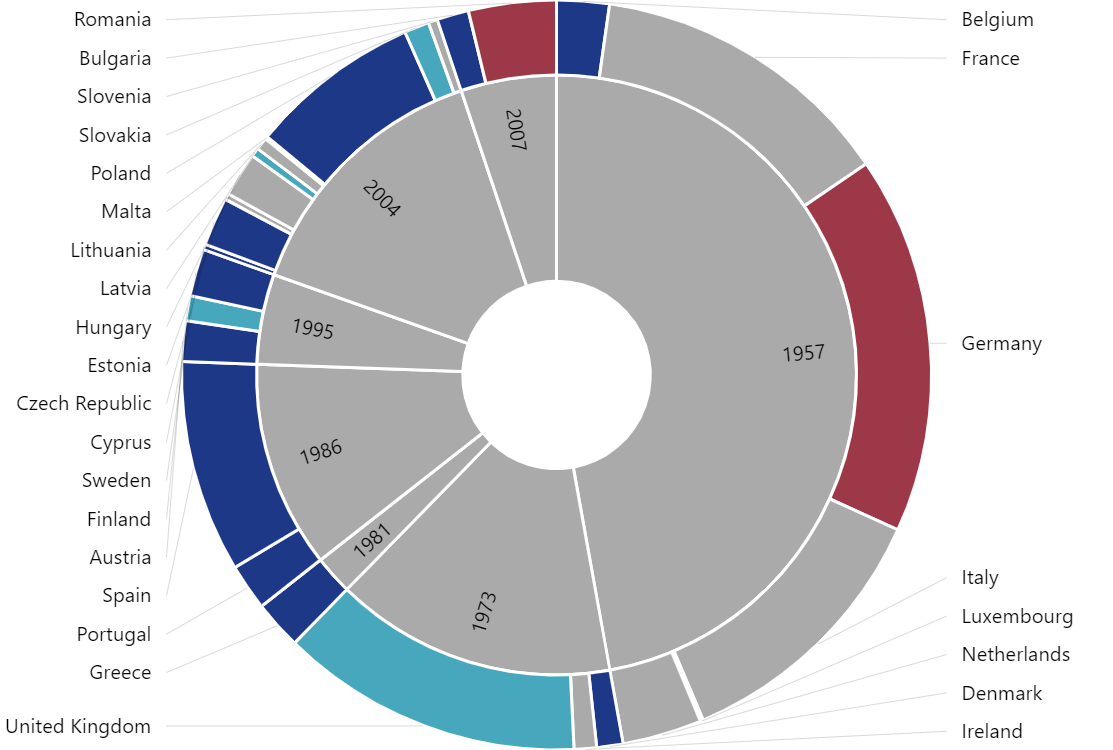
In this demo we create a nested pie chart where the inner slices represent totals for the year and outer slices represent the detailed values comprising these totals.
Key implementation details
To create the inner and outer slices we add two PieSeries to the chart and set radius and innerRadius on both accordingly so they take up the portions of the pie we have designated for them. Our data is in a hierarchical format. We “flatten” it so that all the outer slices are in one array dataset and we create an inner dataset with calculated total values.
Related tutorials
Build this chart with AI
The prompt below can be used to build this chart with AI. For best coding results, use the most advanced AI models, like Claude Opus 4.6 and GPT-5.3-Codex. For more info and tips, check out amCharts AI docs.
Create a nested pie chart visualizing EU membership expansion with two concentric layers. The inner ring shows aggregated population totals by expansion year (1957, 1973, 1981, 1986, 1995, 2004, 2007), and the outer ring shows individual country populations within each year. Use a color scheme with gray, dark blue, teal, and burgundy. Separate all slices with thin white borders. Slices should scale slightly on hover. Tooltips display category name, percentage, and value. Inner labels should be rotated to follow the curve of the ring. Include a smooth animated sequential entrance on load. Use amCharts 5 library.
Demo source