Variable-Radius Radar
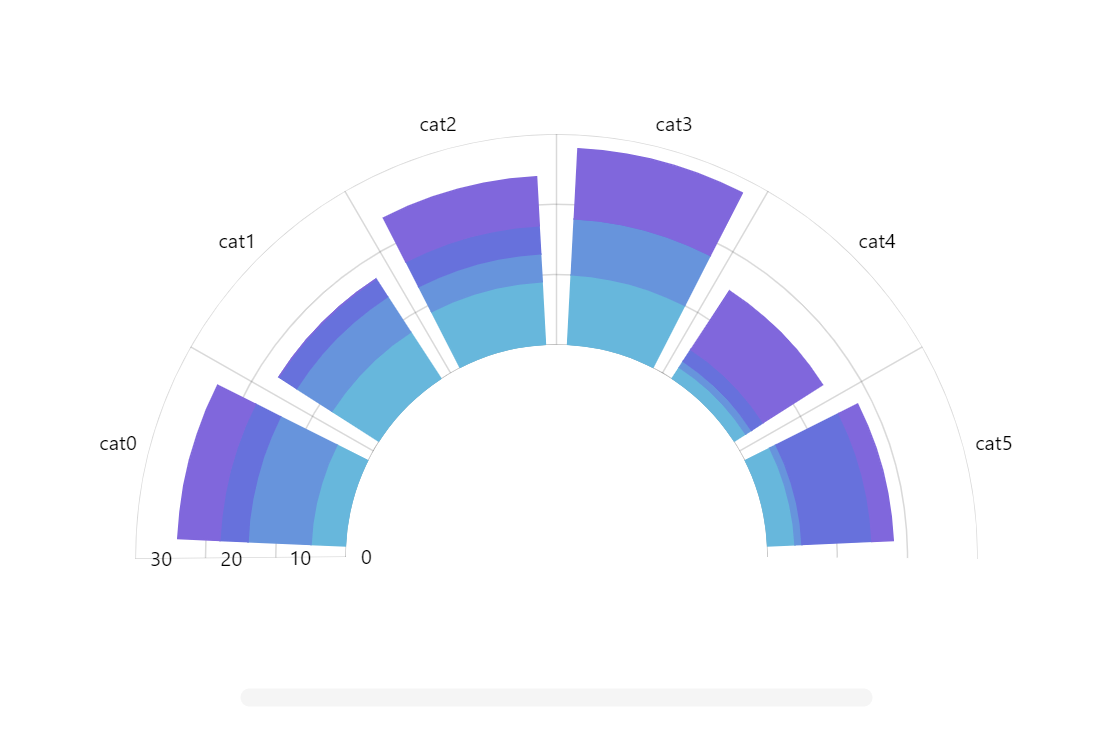
amCharts Radar Chart doesn’t necessarily have to be a perfect circle. It can be anything from full circle to half-arc to a totally flat bar/line chart. Try moving the slider under the chart to change the shape.
Key implementation details
When slider position changes we simply adjust the charts startAngle and endAngle properties. We also set the axisAngle property on the Y axis renderer.
Related tutorials
Build this chart with AI
The prompt below can be used to build this chart with AI. For best coding results, use the most advanced AI models, like Claude Opus 4.6 and GPT-5.3-Codex. For more info and tips, check out amCharts AI docs.
Create a variable-radius radar chart that can dynamically transform its shape between a full circle and a flat bar chart. Display 6 categories with 4 stacked column series using random values between 0-10. Add a horizontal slider control beneath the chart that, when moved, adjusts the chart's arc in real time, morphing the visualization from a complete circular radar chart to a partial arc to a completely flattened bar chart configuration. Use a circular category axis and a radial value axis. Show tooltips with series name and value. Animate initial appearance on load. Use amCharts 5 library.
Demo source