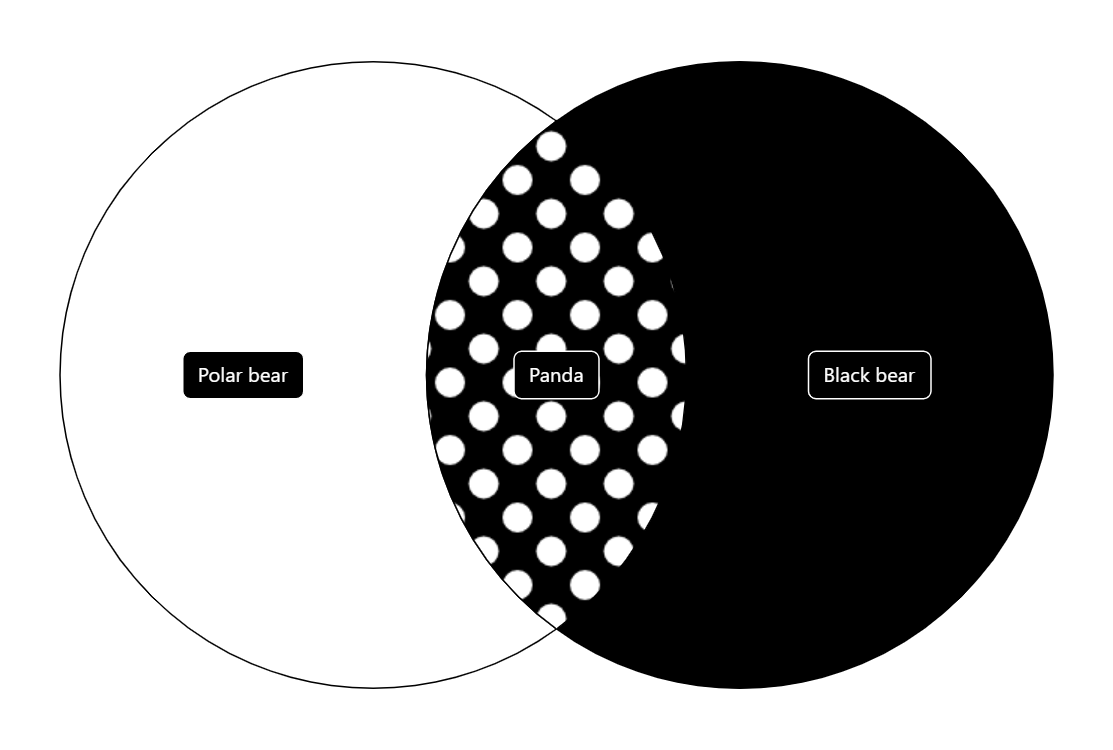
Venn Diagram with Patterns
Venn diagrams are one of the most popular diagram types for showing relationships between sets of data.
Related tutorials
Build this chart with AI
The prompt below can be used to build this chart with AI. For best coding results, use the most advanced AI models, like Claude Opus 4.6 and GPT-5.3-Codex. For more info and tips, check out amCharts AI docs.
Create a Venn diagram with three data items: 'Polar bear' (large, white fill), 'Black bear' (large, black fill), and 'Panda' (smaller, positioned at the intersection of Polar bear and Black bear). Fill the Panda intersection with a checkered pattern combining black and white. Outline all sections with black borders. Use white text labels on dark rounded rectangular backgrounds for readability. On hover, highlight the hovered section with a dashed white border. Apply an animated theme. Use amCharts 5 library.
Demo source