Weather Map
Weather maps is one of the typical use cases for map charts. This demo shows how to use amCharts Maps as a weather map.
Key implementation details
We use MapPointSeries for our city locations on the map and add bullets to the series to display weather icons and labels. templateField settings on the bullets enable the chart to pick the icon and label text from the data.
Related tutorials
Build this chart with AI
The prompt below can be used to build this chart with AI. For best coding results, use the most advanced AI models, like Claude Opus 4.6 and GPT-5.3-Codex. For more info and tips, check out amCharts AI docs.
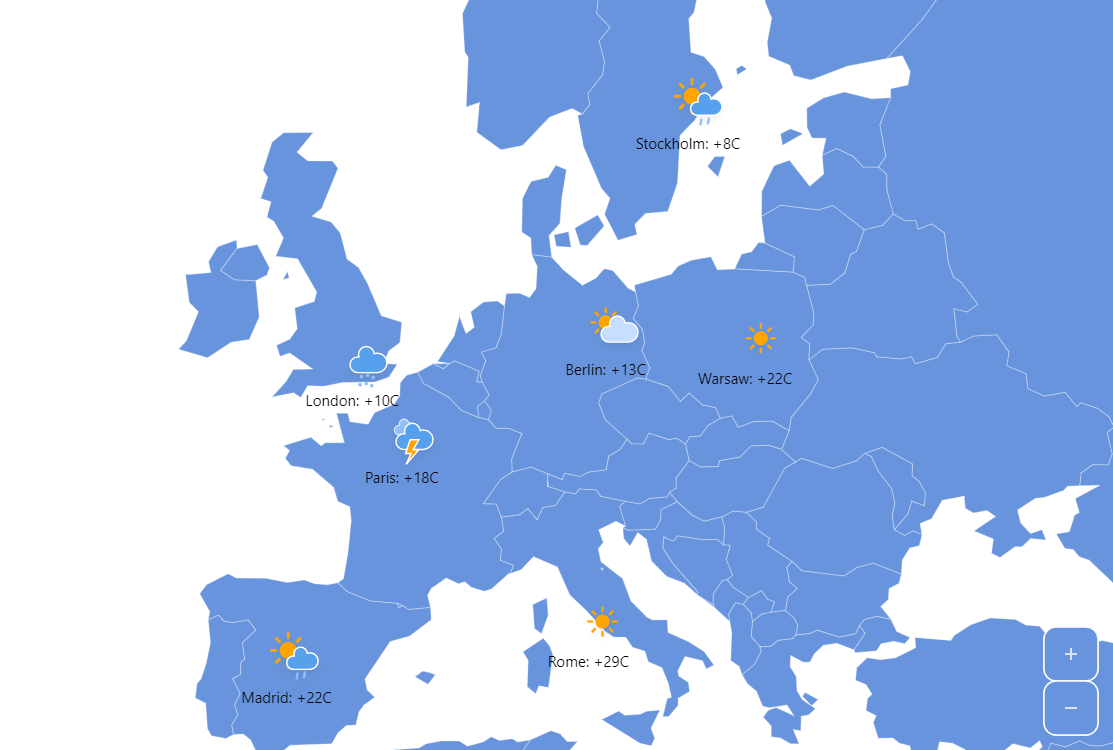
Create a European weather map showing weather conditions for seven cities: Madrid, Paris, Berlin, Warsaw, Rome, London, and Stockholm. Use a country boundary layer as background and place weather markers at each city position. Each city marker should display an animated weather icon showing conditions like rainy, thunderstorm, cloudy, or sunny, along with a label showing the city name and temperature. Center the default view on Europe at an appropriate zoom level. Enable pan functionality and include zoom controls with a home button. Clicking the water/background returns to the home view. Apply smooth entrance animations. Use amCharts 5 library.
Demo source