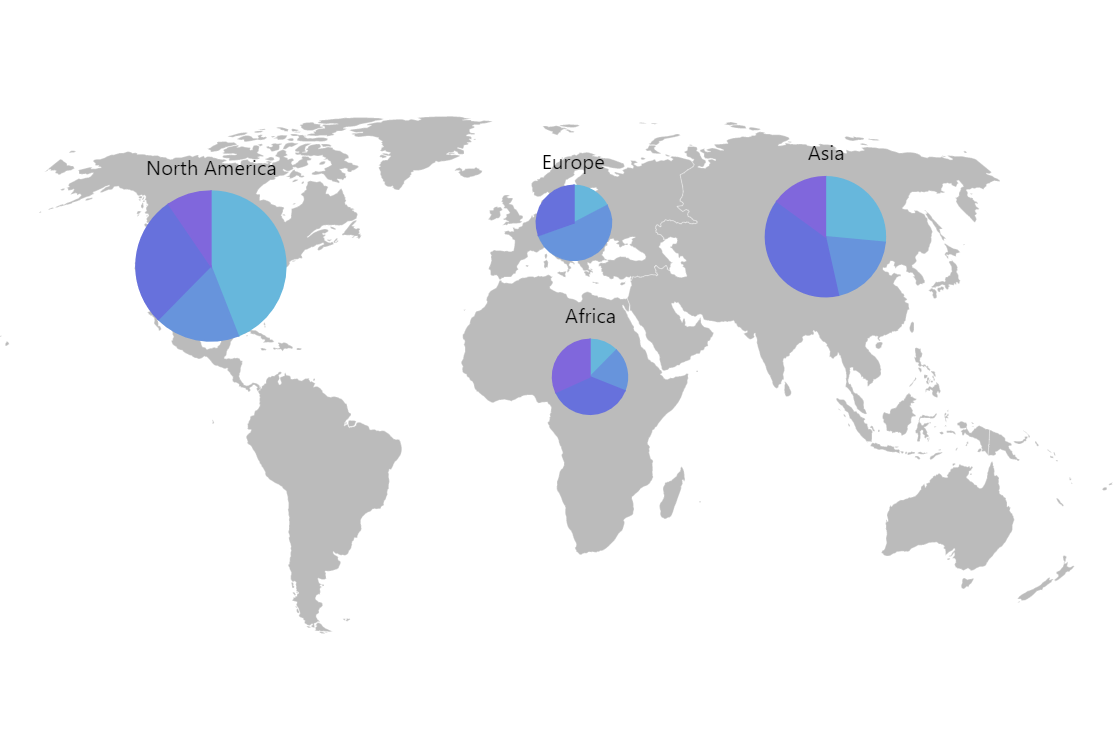
Map with Dynamic Pie Charts
One of the super-powers of amCharts is that you can combine multiple chart types into a single cohesive and interactive visualization. This demo shows interactive pie charts on top of an active zoomable map.
Key implementation details
The key trick here is that we create pie charts as bullets in map point series.
Related tutorials
Build this chart with AI
The prompt below can be used to build this chart with AI. For best coding results, use the most advanced AI models, like Claude Opus 4.6 and GPT-5.3-Codex. For more info and tips, check out amCharts AI docs.
Create a world map with embedded pie charts positioned at geographic coordinates for four regions: North America, Europe, Asia, and Africa. Use a light gray base map layer. Place pie charts at each region's location, with each pie chart displaying several categorical data segments with distinct colors. Scale pie chart sizes by region, with larger charts for larger regions. Display region title labels below each pie chart. The map should be zoomable and pannable. Apply smooth animations. Use amCharts 5 library.
Demo source