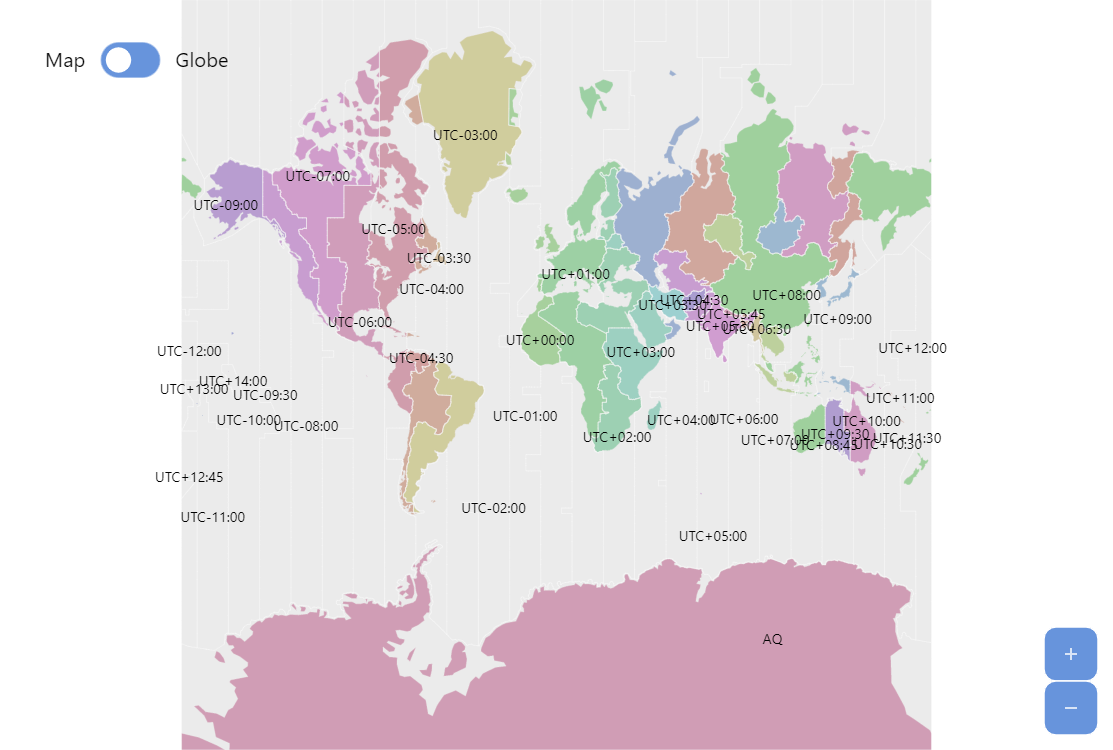
World Time Zone Map
Time zones are notoriously tricky. amCharts maintains several time zone related maps to make it easy for you to display time zone centric maps.
Key implementation details
In this demo we overlay two maps: one that covers whole time zone bands going from pole to pole (worldTimeZonesLow) and another covering land areas by time zone (worldTimeZoneAreasLow).
This demo also enables users to switch between map and globe views which is as easy as supplying a corresponding projection to the amCharts Map Chart.
Related tutorials
Build this chart with AI
The prompt below can be used to build this chart with AI. For best coding results, use the most advanced AI models, like Claude Opus 4.6 and GPT-5.3-Codex. For more info and tips, check out amCharts AI docs.
Create a world time zone map using two overlaid map layers: one showing vertical time zone bands with a very subtle fill, and another showing land-area time zones filled with distinct saturated colors. Increase color intensity on hover. Place time zone ID labels at the center of each zone. Include a toggle button to switch between a flat map projection and a 3D globe view, adjusting pan behavior accordingly. Show zone identifiers in tooltips. Add zoom controls with a home button. Animate the chart on load. Use amCharts 5 library.
Demo source